Logitech 2012 Annual Report Download - page 203
Download and view the complete annual report
Please find page 203 of the 2012 Logitech annual report below. You can navigate through the pages in the report by either clicking on the pages listed below, or by using the keyword search tool below to find specific information within the annual report.-
 1
1 -
2
-
3
-
4
-
5
-
6
-
7
-
8
-
9
-
10
-
11
-
12
-
13
-
14
-
15
-
16
-
17
-
18
-
19
-
20
-
21
-
22
-
23
-
24
-
25
-
26
-
27
-
28
-
29
-
30
-
31
-
32
-
33
-
34
-
35
-
36
-
37
-
38
-
39
-
40
-
41
-
42
-
43
-
44
-
45
-
46
-
47
-
48
-
49
-
50
-
51
-
52
-
53
-
54
-
55
-
56
-
57
-
58
-
59
-
60
-
61
-
62
-
63
-
64
-
65
-
66
-
67
-
68
-
69
-
70
-
71
-
72
-
73
-
74
-
75
-
76
-
77
-
78
-
79
-
80
-
81
-
82
-
83
-
84
-
85
-
86
-
87
-
88
-
89
-
90
-
91
-
92
-
93
-
94
-
95
-
96
-
97
-
98
-
99
-
100
-
101
-
102
-
103
-
104
-
105
-
106
-
107
-
108
-
109
-
110
-
111
-
112
-
113
-
114
-
115
-
116
-
117
-
118
-
119
-
120
-
121
-
122
-
123
-
124
-
125
-
126
-
127
-
128
-
129
-
130
-
131
-
132
-
133
-
134
-
135
-
136
-
137
-
138
-
139
-
140
-
141
-
142
-
143
-
144
-
145
-
146
-
147
-
148
-
149
-
150
-
151
-
152
-
153
-
154
-
155
-
156
-
157
-
158
-
159
-
160
-
161
-
162
-
163
-
164
-
165
-
166
-
167
-
168
-
169
-
170
-
171
-
172
-
173
-
174
-
175
-
176
-
177
-
178
-
179
-
180
-
181
-
182
-
183
-
184
-
185
-
186
-
187
-
188
-
189
-
190
-
191
-
192
-
 193
193 -
 194
194 -
 195
195 -
 196
196 -
 197
197 -
 198
198 -
 199
199 -
 200
200 -
 201
201 -
 202
202 -
 203
203 -
 204
204 -
 205
205 -
 206
206 -
 207
207 -
 208
208 -
 209
209 -
 210
210 -
 211
211 -
 212
212 -
 213
213 -
214
-
215
-
216
-
217
-
218
-
219
-
220
-
221
-
222
-
223
-
224
-
225
-
226
-
227
-
228
-
229
-
230
-
231
-
232
-
233
-
234
-
235
-
236
-
237
-
238
-
239
-
240
-
241
-
242
-
243
-
244
-
245
-
246
-
247
-
248
-
249
-
250
-
251
-
252
-
253
-
254
-
255
-
256
-
257
-
258
-
259
-
260
-
261
-
262
-
263
-
264
-
265
-
266
-
267
-
268
-
269
-
270
-
271
-
272
-
273
-
274
-
275
-
276
-
277
-
278
-
279
-
280
-
281
-
282
-
283
-
284
-
285
-
286
-
287
-
288
-
289
-
290
-
291
-
292
 |
 |

QUANTITATIVE AND QUALITATIVE DISCLOSURES ABOUT MARKET RISK
Market Risk
Market risk represents the potential for loss due to adverse changes in the fair value of financial instruments.
As a global concern, the Company faces exposure to adverse movements in foreign currency exchange rates and
interest rates. These exposures may change over time as business practices evolve and could have a material adverse
impact on the Company’s financial results.
Foreign Currency Exchange Rates
The Company is exposed to foreign currency exchange rate risk as it transacts business in multiple foreign
currencies, including exposure related to anticipated sales, anticipated purchases and assets and liabilities
denominated in currencies other than the U.S. dollar. Logitech transacts business in over 30 currencies worldwide,
of which the most significant to operations are the CNY (Chinese renminbi), Taiwanese dollar, Australian dollar,
Japanese yen, Mexican peso, euro and Canadian dollar. The functional currency of the Company’s operations is
primarily the U.S. dollar. To a lesser extent, certain operations use the euro, CNY, Swiss franc, or the local currency
of the country as their functional currencies. Accordingly, unrealized foreign currency gains or losses resulting
from the translation of net assets or liabilities denominated in foreign currencies to the U.S. dollar are accumulated
in the cumulative translation adjustment component of other comprehensive income in shareholders’ equity.
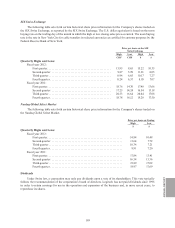
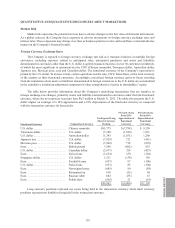
The table below provides information about the Company’s underlying transactions that are sensitive to
foreign exchange rate changes, primarily assets and liabilities denominated in currencies other than the functional
currency, where the net exposure is greater than $0.5 million at March 31, 2012. The table also presents the U.S.
dollar impact on earnings of a 10% appreciation and a 10% depreciation of the functional currency as compared
with the transaction currency (in thousands):
Functional Currency Transaction Currency
Net Exposed Long
(Short) Currency
Position
FX Gain (Loss)
From 10%
Appreciation of
Functional
Currency
FX Gain (Loss)
From 10%
Depreciation of
Functional
Currency
U.S. dollar ...................... Chinese renminbi $85,773 $(7,798) $ 9,530
Taiwanese dollar ................. U.S. dollar 17,380 (1,580) 1,931
U.S. dollar ...................... Australian dollar 11,343 (1,031) 1,260
Japanese yen .................... U.S. dollar (7,929) 721 (881)
Mexican peso . . . . . . . . . . . . . . . . . . . U.S. dollar (7,902) 718 (878)
Euro ........................... British pound 7,500 (682) 833
U.S. dollar ...................... Canadian dollar (3,937) 358 (437)
Euro ........................... Swiss franc (1,654) 150 (184)
Singapore dollar . . . . . . . . . . . . . . . . . U.S. dollar 1,521 (138) 169
Euro ........................... Swedish krona (957) 87 (106)
U.S. dollar ...................... Swiss franc (935) 85 (104)
Euro ........................... Norwegian krone (885) 80 (98)
Euro ........................... Romanian leu 610 (55) 68
Euro ........................... Russian ruble 602 (55) 67
Euro ........................... Polish zloty (565) 51 (63)
$99,965 $ (9,089) $ 11,107
Long currency positions represent net assets being held in the transaction currency while short currency
positions represent net liabilities being held in the transaction currency.
ANNUAL REPORT
193