Logitech 2012 Annual Report Download - page 183
Download and view the complete annual report
Please find page 183 of the 2012 Logitech annual report below. You can navigate through the pages in the report by either clicking on the pages listed below, or by using the keyword search tool below to find specific information within the annual report.-
 1
1 -
2
-
3
-
4
-
5
-
6
-
7
-
8
-
9
-
10
-
11
-
12
-
13
-
14
-
15
-
16
-
17
-
18
-
19
-
20
-
21
-
22
-
23
-
24
-
25
-
26
-
27
-
28
-
29
-
30
-
31
-
32
-
33
-
34
-
35
-
36
-
37
-
38
-
39
-
40
-
41
-
42
-
43
-
44
-
45
-
46
-
47
-
48
-
49
-
50
-
51
-
52
-
53
-
54
-
55
-
56
-
57
-
58
-
59
-
60
-
61
-
62
-
63
-
64
-
65
-
66
-
67
-
68
-
69
-
70
-
71
-
72
-
73
-
74
-
75
-
76
-
77
-
78
-
79
-
80
-
81
-
82
-
83
-
84
-
85
-
86
-
87
-
88
-
89
-
90
-
91
-
92
-
93
-
94
-
95
-
96
-
97
-
98
-
99
-
100
-
101
-
102
-
103
-
104
-
105
-
106
-
107
-
108
-
109
-
110
-
111
-
112
-
113
-
114
-
115
-
116
-
117
-
118
-
119
-
120
-
121
-
122
-
123
-
124
-
125
-
126
-
127
-
128
-
129
-
130
-
131
-
132
-
133
-
134
-
135
-
136
-
137
-
138
-
139
-
140
-
141
-
142
-
143
-
144
-
145
-
146
-
147
-
148
-
149
-
150
-
151
-
152
-
153
-
154
-
155
-
156
-
157
-
158
-
159
-
160
-
161
-
162
-
163
-
164
-
165
-
166
-
167
-
168
-
169
-
170
-
171
-
172
-
 173
173 -
 174
174 -
 175
175 -
 176
176 -
 177
177 -
 178
178 -
 179
179 -
 180
180 -
 181
181 -
 182
182 -
 183
183 -
 184
184 -
 185
185 -
 186
186 -
 187
187 -
 188
188 -
 189
189 -
 190
190 -
 191
191 -
 192
192 -
 193
193 -
194
-
195
-
196
-
197
-
198
-
199
-
200
-
201
-
202
-
203
-
204
-
205
-
206
-
207
-
208
-
209
-
210
-
211
-
212
-
213
-
214
-
215
-
216
-
217
-
218
-
219
-
220
-
221
-
222
-
223
-
224
-
225
-
226
-
227
-
228
-
229
-
230
-
231
-
232
-
233
-
234
-
235
-
236
-
237
-
238
-
239
-
240
-
241
-
242
-
243
-
244
-
245
-
246
-
247
-
248
-
249
-
250
-
251
-
252
-
253
-
254
-
255
-
256
-
257
-
258
-
259
-
260
-
261
-
262
-
263
-
264
-
265
-
266
-
267
-
268
-
269
-
270
-
271
-
272
-
273
-
274
-
275
-
276
-
277
-
278
-
279
-
280
-
281
-
282
-
283
-
284
-
285
-
286
-
287
-
288
-
289
-
290
-
291
-
292
 |
 |

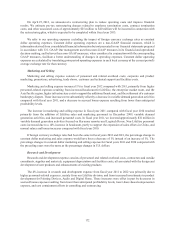
The increase in research and development expense for fiscal year 2011 compared with 2010 was due to the
addition of LifeSize personnel and expenses. Research and development expenses in our peripherals business
remained largely flat in fiscal year 2011 compared with 2010, as expenditures were re-aligned from mature product
lines and multiple similar products to product lines with expected future growth potential.
If foreign currency exchange rates had been the same in fiscal years 2012 and 2011, the change in constant
dollar research and development expense would have been an increase of 1% instead of 4%. If foreign currency
exchange rates had been the same in fiscal years 2011 and 2010, the change in constant dollar research and
development expense would have been 13%.
General and Administrative
General and administrative expense consists primarily of personnel and related overhead and facilities costs
for the finance, information systems, executive, human resources and legal functions.
General and administrative expense increased by 1% from fiscal year 2011 to 2012, primarily due to higher
personnel-related expenses resulting from increased headcount, mainly from our LifeSize division, offset in part
by a decrease in accrued bonus expense resulting from lower than anticipated profitability levels and lower share-
based compensation expense resulting from executive departures.
General and administrative expense excluding LifeSize increased moderately in fiscal year 2011 compared
with 2010, primarily due to increased personnel expenses resulting from normal salary and bonus increases related
to our improved profitability compared with the preceding fiscal year.
If foreign currency exchange rates had been the same in fiscal years 2012 and 2011, the percentage change
in constant dollar general and administrative expense would have been a decrease of 1% instead of an increase of
1%. If foreign currency exchange rates had been the same in fiscal years 2011 and 2010, the percentage change in
constant dollar general and administrative expenses would be the same as the percentage change in U.S. dollars.
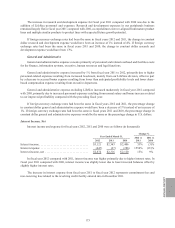
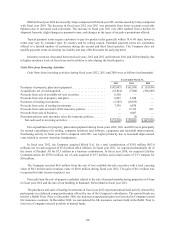
Interest Income, Net
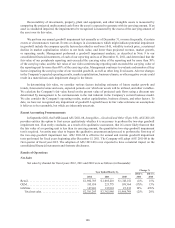
Interest income and expense for fiscal years 2012, 2011 and 2010 were as follows (in thousands):
Year Ended March 31,
Change %
2012 vs
2011
2011 vs
20102012 2011 2010
Interest income .................................. $3,121 $2,343 $2,406 33% (3)%
Interest expense . . . . . . . . . . . . . . . . . . . . . . . . . . . . . . . . . (447) (27) (286) 1556% (91)%
Interest income, net . . . . . . . . . . . . . . . . . . . . . . . . . . . . . . $2,674 $2,316 $2,120 15% 9%
In fiscal year 2012 compared with 2011, interest income was higher primarily due to higher interest rates. In
fiscal year 2011 compared with 2010, interest income was slightly lower due to lower invested balances offset by
slightly higher interest rates.
The increase in interest expense from fiscal year 2011 to fiscal year 2012 represents commitment fees and
non-recurring fees related to the revolving credit facility entered into in December 2011.
ANNUAL REPORT
173