Logitech 2012 Annual Report Download - page 255
Download and view the complete annual report
Please find page 255 of the 2012 Logitech annual report below. You can navigate through the pages in the report by either clicking on the pages listed below, or by using the keyword search tool below to find specific information within the annual report.-
 1
1 -
2
-
3
-
4
-
5
-
6
-
7
-
8
-
9
-
10
-
11
-
12
-
13
-
14
-
15
-
16
-
17
-
18
-
19
-
20
-
21
-
22
-
23
-
24
-
25
-
26
-
27
-
28
-
29
-
30
-
31
-
32
-
33
-
34
-
35
-
36
-
37
-
38
-
39
-
40
-
41
-
42
-
43
-
44
-
45
-
46
-
47
-
48
-
49
-
50
-
51
-
52
-
53
-
54
-
55
-
56
-
57
-
58
-
59
-
60
-
61
-
62
-
63
-
64
-
65
-
66
-
67
-
68
-
69
-
70
-
71
-
72
-
73
-
74
-
75
-
76
-
77
-
78
-
79
-
80
-
81
-
82
-
83
-
84
-
85
-
86
-
87
-
88
-
89
-
90
-
91
-
92
-
93
-
94
-
95
-
96
-
97
-
98
-
99
-
100
-
101
-
102
-
103
-
104
-
105
-
106
-
107
-
108
-
109
-
110
-
111
-
112
-
113
-
114
-
115
-
116
-
117
-
118
-
119
-
120
-
121
-
122
-
123
-
124
-
125
-
126
-
127
-
128
-
129
-
130
-
131
-
132
-
133
-
134
-
135
-
136
-
137
-
138
-
139
-
140
-
141
-
142
-
143
-
144
-
145
-
146
-
147
-
148
-
149
-
150
-
151
-
152
-
153
-
154
-
155
-
156
-
157
-
158
-
159
-
160
-
161
-
162
-
163
-
164
-
165
-
166
-
167
-
168
-
169
-
170
-
171
-
172
-
173
-
174
-
175
-
176
-
177
-
178
-
179
-
180
-
181
-
182
-
183
-
184
-
185
-
186
-
187
-
188
-
189
-
190
-
191
-
192
-
193
-
194
-
195
-
196
-
197
-
198
-
199
-
200
-
201
-
202
-
203
-
204
-
205
-
206
-
207
-
208
-
209
-
210
-
211
-
212
-
213
-
214
-
215
-
216
-
217
-
218
-
219
-
220
-
221
-
222
-
223
-
224
-
225
-
226
-
227
-
228
-
229
-
230
-
231
-
232
-
233
-
234
-
235
-
236
-
237
-
238
-
239
-
240
-
241
-
242
-
243
-
244
-
 245
245 -
 246
246 -
 247
247 -
 248
248 -
 249
249 -
 250
250 -
 251
251 -
 252
252 -
 253
253 -
 254
254 -
 255
255 -
 256
256 -
 257
257 -
 258
258 -
 259
259 -
 260
260 -
 261
261 -
 262
262 -
 263
263 -
 264
264 -
 265
265 -
266
-
267
-
268
-
269
-
270
-
271
-
272
-
273
-
274
-
275
-
276
-
277
-
278
-
279
-
280
-
281
-
282
-
283
-
284
-
285
-
286
-
287
-
288
-
289
-
290
-
291
-
292
 |
 |

LOGITECH INTERNATIONAL S.A.
NOTES TO CONSOLIDATED FINANCIAL STATEMENTS (Continued)
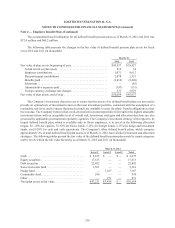
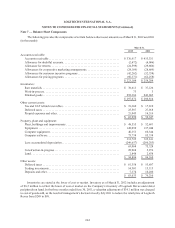
The increase in construction-in-progress primarily relates to new facilities for the Company’s Americas
operations in Northern California.
The following provides the components of certain balance sheet liability amounts as of March 31, 2012 and
2011 (in thousands):
March 31,
2012 2011
Accrued liabilities:
Accrued personnel expenses ............................................. $ 42,809 $ 50,552
Accrued marketing expenses............................................. 33,209 32,599
Deferred revenue ...................................................... 19,358 15,859
Accrued freight and duty ................................................ 11,376 12,497
VAT payable.......................................................... 7,140 5,614
Accrued royalties ...................................................... 6,243 5,144
Warranty accrual ...................................................... 5,184 4,970
Non-retirement post-employment benefit obligations.......................... 4,129 3,563
Income taxes payable—current ........................................... 6,047 2,569
Other accrued liabilities................................................. 51,185 39,193
$186,680 $172,560
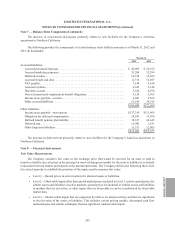
Other liabilities:
Income taxes payable—non-current ....................................... $137,319 $131,968
Obligation for deferred compensation ...................................... 14,393 13,076
Defined benefit pension plan liability ...................................... 39,337 26,645
Deferred rent ......................................................... 16,042 1,181
Other long-term liabilities ............................................... 11,371 12,965
$218,462 $185,835
The increase in deferred rent primarily relates to new facilities for the Company’s Americas operations in
Northern California.
Note 8 — Financial Instruments
Fair Value Measurements
The Company considers fair value as the exchange price that would be received for an asset or paid to
transfer a liability (an exit price) in the principal or most advantageous market for the asset or liability in an orderly
transaction between market participants at the measurement date. The Company utilizes the following three-level
fair value hierarchy to establish the priorities of the inputs used to measure fair value:
• Level 1—Quoted prices in active markets for identical assets or liabilities.
• Level 2—Observable inputs other than quoted market prices included in Level 1, such as quoted prices for
similar assets and liabilities in active markets; quoted prices for identical or similar assets and liabilities
in markets that are not active; or other inputs that are observable or can be corroborated by observable
market data.
• Level 3—Unobservable inputs that are supported by little or no market activity and that are significant
to the fair value of the assets or liabilities. This includes certain pricing models, discounted cash flow
methodologies and similar techniques that use significant unobservable inputs.
Note 7 — Balance Sheet Components (Continued)
ANNUAL REPORT
245