Logitech 2012 Annual Report Download - page 127
Download and view the complete annual report
Please find page 127 of the 2012 Logitech annual report below. You can navigate through the pages in the report by either clicking on the pages listed below, or by using the keyword search tool below to find specific information within the annual report.-
 1
1 -
2
-
3
-
4
-
5
-
6
-
7
-
8
-
9
-
10
-
11
-
12
-
13
-
14
-
15
-
16
-
17
-
18
-
19
-
20
-
21
-
22
-
23
-
24
-
25
-
26
-
27
-
28
-
29
-
30
-
31
-
32
-
33
-
34
-
35
-
36
-
37
-
38
-
39
-
40
-
41
-
42
-
43
-
44
-
45
-
46
-
47
-
48
-
49
-
50
-
51
-
52
-
53
-
54
-
55
-
56
-
57
-
58
-
59
-
60
-
61
-
62
-
63
-
64
-
65
-
66
-
67
-
68
-
69
-
70
-
71
-
72
-
73
-
74
-
75
-
76
-
77
-
78
-
79
-
80
-
81
-
82
-
83
-
84
-
85
-
86
-
87
-
88
-
89
-
90
-
91
-
92
-
93
-
94
-
95
-
96
-
97
-
98
-
99
-
100
-
101
-
102
-
103
-
104
-
105
-
106
-
107
-
108
-
109
-
110
-
111
-
112
-
113
-
114
-
115
-
116
-
 117
117 -
 118
118 -
 119
119 -
 120
120 -
 121
121 -
 122
122 -
 123
123 -
 124
124 -
 125
125 -
 126
126 -
 127
127 -
 128
128 -
 129
129 -
 130
130 -
 131
131 -
 132
132 -
 133
133 -
 134
134 -
 135
135 -
 136
136 -
 137
137 -
138
-
139
-
140
-
141
-
142
-
143
-
144
-
145
-
146
-
147
-
148
-
149
-
150
-
151
-
152
-
153
-
154
-
155
-
156
-
157
-
158
-
159
-
160
-
161
-
162
-
163
-
164
-
165
-
166
-
167
-
168
-
169
-
170
-
171
-
172
-
173
-
174
-
175
-
176
-
177
-
178
-
179
-
180
-
181
-
182
-
183
-
184
-
185
-
186
-
187
-
188
-
189
-
190
-
191
-
192
-
193
-
194
-
195
-
196
-
197
-
198
-
199
-
200
-
201
-
202
-
203
-
204
-
205
-
206
-
207
-
208
-
209
-
210
-
211
-
212
-
213
-
214
-
215
-
216
-
217
-
218
-
219
-
220
-
221
-
222
-
223
-
224
-
225
-
226
-
227
-
228
-
229
-
230
-
231
-
232
-
233
-
234
-
235
-
236
-
237
-
238
-
239
-
240
-
241
-
242
-
243
-
244
-
245
-
246
-
247
-
248
-
249
-
250
-
251
-
252
-
253
-
254
-
255
-
256
-
257
-
258
-
259
-
260
-
261
-
262
-
263
-
264
-
265
-
266
-
267
-
268
-
269
-
270
-
271
-
272
-
273
-
274
-
275
-
276
-
277
-
278
-
279
-
280
-
281
-
282
-
283
-
284
-
285
-
286
-
287
-
288
-
289
-
290
-
291
-
292
 |
 |

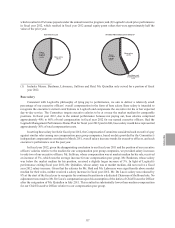
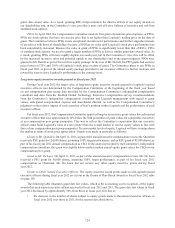
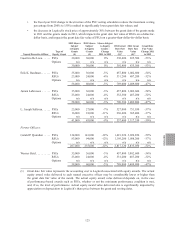
which resulted in 0% bonus payouts under the annual incentive program; and (2) Logitech’s stock price performance
in fiscal year 2012, which resulted in fiscal year 2012 annual equity grant values that were approximately half the
value of the prior year.
Base salary
56.0%
Equity
incentive
awards
44.0%
Guerrino De Luca
All Other Named Executive Officers
(1)
Short-term cash
incentive awards
0.5%
Base salary
42.9%
Equity
incentive
awards
56.6%
(1) Includes Messrs. Bardman, Labrousse, Sullivan and Heid. Mr. Quindlen only served for a portion of fiscal
year 2012.
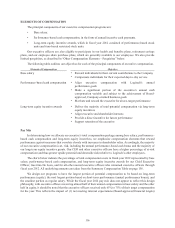
Base salary
Consistent with Logitech’s philosophy of tying pay to performance, we aim to deliver a relatively small
percentage of our executive officers’ overall compensation in the form of base salary. Base salary is intended to
recognize the executive’s current contributions to Logitech and compensate the executive for his or her expected
day-to-day service. The Committee targets executive salaries to be at or near the market median for comparable
positions. In fiscal year 2012, due to the annual performance bonuses not paying out, base salaries comprised
approximately 40% to 60% of total compensation in fiscal year 2012 for our named executive officers. Had the
Logitech Management Performance Bonus Plan for fiscal year 2012 paid in full, base salary would have represented
approximately 30% of total compensation costs.
In setting base salary levels for fiscal year 2012, the Compensation Committee considered each executive’s pay
against similar roles among our compensation peer group companies, based on data provided by the Committee’s
independent compensation consultant in March 2011, overall salary increase trends for executive officers, and each
executive’s performance over the past year.
In fiscal year 2012, given the disappointing conclusion to our fiscal year 2011 and the position of our executive
officers’ salaries relative to the median for our compensation peer group companies, we provided salary increases
to only two of our executive officers. Mr. Sullivan, whose compensation was at market median for his role, received
an increase of 3%, which was the average increase for our compensation peer group. Mr. Bardman, whose salary
was below the market median for his position, received a slightly larger increase of 5%. In light of Logitech’s
performance exiting fiscal year 2011, Mr. Quindlen, whose salary was at market median, did not receive a fiscal
year 2012 salary increase. Given that the salaries for Mr. Heid and Mr. Labrousse were significantly above market
median for their roles, neither received a salary increase in fiscal year 2012. Mr. De Luca’s salary was reduced by
9% at the start of the fiscal year to recognize his continued transition to a dedicated Chairman of the Board role. No
adjustment was made to Mr. De Luca’s compensation upon his assumption of the duties of Chief Executive Officer
after the resignation of Mr. Quindlen in July 2011. This resulted in substantially lower-than-median compensation
for our Chief Executive Officer relative to our compensation peer group.
ENGLISH
117