Logitech 2012 Annual Report Download - page 256
Download and view the complete annual report
Please find page 256 of the 2012 Logitech annual report below. You can navigate through the pages in the report by either clicking on the pages listed below, or by using the keyword search tool below to find specific information within the annual report.-
 1
1 -
2
-
3
-
4
-
5
-
6
-
7
-
8
-
9
-
10
-
11
-
12
-
13
-
14
-
15
-
16
-
17
-
18
-
19
-
20
-
21
-
22
-
23
-
24
-
25
-
26
-
27
-
28
-
29
-
30
-
31
-
32
-
33
-
34
-
35
-
36
-
37
-
38
-
39
-
40
-
41
-
42
-
43
-
44
-
45
-
46
-
47
-
48
-
49
-
50
-
51
-
52
-
53
-
54
-
55
-
56
-
57
-
58
-
59
-
60
-
61
-
62
-
63
-
64
-
65
-
66
-
67
-
68
-
69
-
70
-
71
-
72
-
73
-
74
-
75
-
76
-
77
-
78
-
79
-
80
-
81
-
82
-
83
-
84
-
85
-
86
-
87
-
88
-
89
-
90
-
91
-
92
-
93
-
94
-
95
-
96
-
97
-
98
-
99
-
100
-
101
-
102
-
103
-
104
-
105
-
106
-
107
-
108
-
109
-
110
-
111
-
112
-
113
-
114
-
115
-
116
-
117
-
118
-
119
-
120
-
121
-
122
-
123
-
124
-
125
-
126
-
127
-
128
-
129
-
130
-
131
-
132
-
133
-
134
-
135
-
136
-
137
-
138
-
139
-
140
-
141
-
142
-
143
-
144
-
145
-
146
-
147
-
148
-
149
-
150
-
151
-
152
-
153
-
154
-
155
-
156
-
157
-
158
-
159
-
160
-
161
-
162
-
163
-
164
-
165
-
166
-
167
-
168
-
169
-
170
-
171
-
172
-
173
-
174
-
175
-
176
-
177
-
178
-
179
-
180
-
181
-
182
-
183
-
184
-
185
-
186
-
187
-
188
-
189
-
190
-
191
-
192
-
193
-
194
-
195
-
196
-
197
-
198
-
199
-
200
-
201
-
202
-
203
-
204
-
205
-
206
-
207
-
208
-
209
-
210
-
211
-
212
-
213
-
214
-
215
-
216
-
217
-
218
-
219
-
220
-
221
-
222
-
223
-
224
-
225
-
226
-
227
-
228
-
229
-
230
-
231
-
232
-
233
-
234
-
235
-
236
-
237
-
238
-
239
-
240
-
241
-
242
-
243
-
244
-
245
-
 246
246 -
 247
247 -
 248
248 -
 249
249 -
 250
250 -
 251
251 -
 252
252 -
 253
253 -
 254
254 -
 255
255 -
 256
256 -
 257
257 -
 258
258 -
 259
259 -
 260
260 -
 261
261 -
 262
262 -
 263
263 -
 264
264 -
 265
265 -
 266
266 -
267
-
268
-
269
-
270
-
271
-
272
-
273
-
274
-
275
-
276
-
277
-
278
-
279
-
280
-
281
-
282
-
283
-
284
-
285
-
286
-
287
-
288
-
289
-
290
-
291
-
292
 |
 |

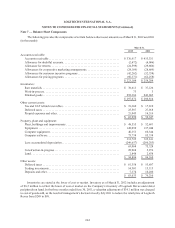
LOGITECH INTERNATIONAL S.A.
NOTES TO CONSOLIDATED FINANCIAL STATEMENTS (Continued)
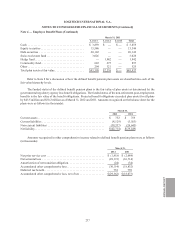
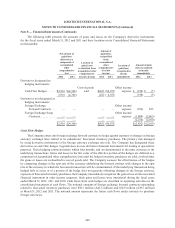
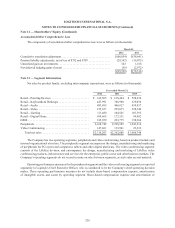
The following table presents the Company’s financial assets and liabilities, except for assets related to the
Company’s defined benefit pension plan assets which are described and disclosed in Note 4, that were accounted
for at fair value, classified by the level within the fair value hierarchy (in thousands):
March 31, 2012 March 31, 2011
Level 1 Level 2 Level 3 Level 1 Level 2 Level 3
Cash and cash equivalents . . . . . . . . . . . . . . . . . $ 478,370 $ — $ — $477,931 $ — $ —
Trading investments ...................... 14,301 — — 13,113 — —
Available-for-sale securities ................ — — 429 — — 1,695
Foreign exchange derivative assets . . . . . . . . . . — 658 — — 566 —
Total assets at fair value . . . . . . . . . . . . . . . . . . . $ 492,671 $658 $429 $491,044 $ 566 $1,695
Foreign exchange derivative liabilities ........ $ — $245 $ — $ — $1,881 $ —
Total liabilities at fair value . . . . . . . . . . . . . . . . $ — $245 $ — $ — $1,881 $ —
The Company reclassified its foreign exchange derivative assets and liabilities from Level 1 of the fair value
hierarchy to Level 2 beginning the quarter ended December 31, 2011, to reflect the inputs used to measure fair
value as observable inputs other than quoted market prices.
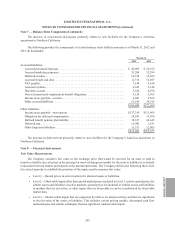
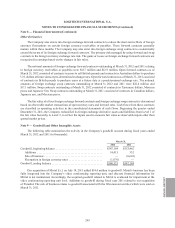
The following table presents the changes in the Company’s Level 3 financial assets during the fiscal years
ended March 31, 2012, 2011 and 2010 (in thousands):
March 31,
2012 2011 2010
Available-for-sale securities, beginning balance.................. $ 1,695 $ 994 $1,637
Proceeds from sales of securities........................... (6,550) — —
Realized gain on sales of securities ......................... 6,050 — —
Realized loss on sales of securities ......................... (9) — —
Unrealized gain ........................................ — 744 —
Unrealized loss......................................... (757) (43) (643)
Available-for-sale securities, ending balance .................... $ 429 $1,695 $ 994
Cash and Cash Equivalents
Cash and cash equivalents consist of bank demand deposits and time deposits. The time deposits have original
terms of less than 62 days. Cash and cash equivalents are carried at cost, which approximates fair value.
Investment Securities
The Company’s investment securities portfolio consists of marketable securities related to a deferred
compensation plan and auction rate securities collateralized by residential and commercial mortgages.
The marketable securities related to the deferred compensation plan are classified as non-current trading
investments and do not have maturity dates. Since participants in the deferred compensation plan may select the
mutual funds in which their compensation deferrals are invested, and may actively trade funds within the confines
of the Rabbi Trust which holds the marketable securities, the Company has designated these marketable securities
as trading investments. Management has classified the investments as non-current assets because final sale of the
investments or realization of proceeds by plan participants is not expected within the Company’s normal operating
Note 8 — Financial Instruments (Continued)
246