Logitech 2012 Annual Report Download - page 176
Download and view the complete annual report
Please find page 176 of the 2012 Logitech annual report below. You can navigate through the pages in the report by either clicking on the pages listed below, or by using the keyword search tool below to find specific information within the annual report.-
 1
1 -
2
-
3
-
4
-
5
-
6
-
7
-
8
-
9
-
10
-
11
-
12
-
13
-
14
-
15
-
16
-
17
-
18
-
19
-
20
-
21
-
22
-
23
-
24
-
25
-
26
-
27
-
28
-
29
-
30
-
31
-
32
-
33
-
34
-
35
-
36
-
37
-
38
-
39
-
40
-
41
-
42
-
43
-
44
-
45
-
46
-
47
-
48
-
49
-
50
-
51
-
52
-
53
-
54
-
55
-
56
-
57
-
58
-
59
-
60
-
61
-
62
-
63
-
64
-
65
-
66
-
67
-
68
-
69
-
70
-
71
-
72
-
73
-
74
-
75
-
76
-
77
-
78
-
79
-
80
-
81
-
82
-
83
-
84
-
85
-
86
-
87
-
88
-
89
-
90
-
91
-
92
-
93
-
94
-
95
-
96
-
97
-
98
-
99
-
100
-
101
-
102
-
103
-
104
-
105
-
106
-
107
-
108
-
109
-
110
-
111
-
112
-
113
-
114
-
115
-
116
-
117
-
118
-
119
-
120
-
121
-
122
-
123
-
124
-
125
-
126
-
127
-
128
-
129
-
130
-
131
-
132
-
133
-
134
-
135
-
136
-
137
-
138
-
139
-
140
-
141
-
142
-
143
-
144
-
145
-
146
-
147
-
148
-
149
-
150
-
151
-
152
-
153
-
154
-
155
-
156
-
157
-
158
-
159
-
160
-
161
-
162
-
163
-
164
-
165
-
 166
166 -
 167
167 -
 168
168 -
 169
169 -
 170
170 -
 171
171 -
 172
172 -
 173
173 -
 174
174 -
 175
175 -
 176
176 -
 177
177 -
 178
178 -
 179
179 -
 180
180 -
 181
181 -
 182
182 -
 183
183 -
 184
184 -
 185
185 -
 186
186 -
187
-
188
-
189
-
190
-
191
-
192
-
193
-
194
-
195
-
196
-
197
-
198
-
199
-
200
-
201
-
202
-
203
-
204
-
205
-
206
-
207
-
208
-
209
-
210
-
211
-
212
-
213
-
214
-
215
-
216
-
217
-
218
-
219
-
220
-
221
-
222
-
223
-
224
-
225
-
226
-
227
-
228
-
229
-
230
-
231
-
232
-
233
-
234
-
235
-
236
-
237
-
238
-
239
-
240
-
241
-
242
-
243
-
244
-
245
-
246
-
247
-
248
-
249
-
250
-
251
-
252
-
253
-
254
-
255
-
256
-
257
-
258
-
259
-
260
-
261
-
262
-
263
-
264
-
265
-
266
-
267
-
268
-
269
-
270
-
271
-
272
-
273
-
274
-
275
-
276
-
277
-
278
-
279
-
280
-
281
-
282
-
283
-
284
-
285
-
286
-
287
-
288
-
289
-
290
-
291
-
292
 |
 |

Recoverability of investments, property, plant and equipment, and other intangible assets is measured by
comparing the projected undiscounted cash flows the asset is expected to generate with its carrying amount. If an
asset is considered impaired, the impairment to be recognized is measured by the excess of the carrying amount of
the asset over its fair value.
We perform our annual goodwill impairment test annually as of December 31, or more frequently, if certain
events or circumstances warrant. Events or changes in circumstances which might indicate potential impairment
in goodwill include the company specific factors described in our Form 10-K, volatility in stock price, a sustained
decline in market capitalization relative to net book value, and lower than projected revenue, market growth,
or operating results. Management performed a goodwill impairment analysis, as described in Note 9 to our
consolidated financial statements, of each of our reporting units as of December 31, 2011, and determined that the
fair value of our peripherals reporting unit exceeded the carrying value of the reporting unit by more than 30%
of the carrying value, and the fair value of our video conferencing reporting unit exceeded the carrying value of
the reporting unit by more than 80% of the carrying value. Management continues to evaluate and monitor all key
factors impacting the carrying value of our recorded goodwill, as well as other long lived assets. Adverse changes
in the Company’s expected operating results, market capitalization, business climate, or other negative events could
result in a material non-cash impairment charge in the future.
In determining fair value, we consider various factors including estimates of future market growth and
trends, forecasted revenue and costs, expected periods over which our assets will be utilized, and other variables.
We calculate the Company’s fair value based on the present value of projected cash flows using a discount rate
determined by management to be commensurate to the risk inherent in the Company’s current business model.
We also consider the Company’s operating results, market capitalization, business climate, and other factors. To
date, we have not recognized any impairment of goodwill. Logitech bases its fair value estimates on assumptions
it believes to be reasonable, but which are inherently uncertain.
Recent Accounting Pronouncements
In September 2011, the FASB issued ASU 2011-08, Intangibles—Goodwill and Other (Topic 350). ASU 2011-08
provides entities the option to first assess qualitatively whether it is necessary to perform the two-step goodwill
impairment test. If an entity concludes, as a result of its qualitative assessment, that it is more likely than not that
the fair value of a reporting unit is less than its carrying amount, the quantitative two-step goodwill impairment
test is required. An entity may elect to bypass the qualitative assessment and proceed to perform the first step of
the two-step goodwill impairment test. ASU 2011-08 is effective for annual and interim goodwill impairment
tests performed for fiscal years beginning after December 15, 2011. The Company will adopt ASU 2011-08 in the
first quarter of fiscal year 2013. The adoption of ASU 2011-08 is not expected to have a material impact on the
consolidated financial statements and footnote disclosures.
Results of Operations
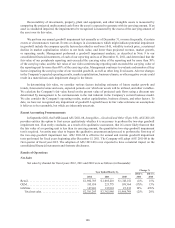
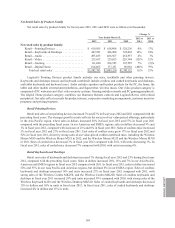
Net Sales
Net sales by channel for fiscal years 2012, 2011 and 2010 were as follows (in thousands):
Year Ended March 31, Change %
2012 vs
2011
2011 vs
20102012 2011 2010
Retail ................................... $1,982,783 $2,005,210 $1,745,152 (1)% 15%
OEM.................................... 185,959 223,775 198,364 (17)% 13%
LifeSize ................................. 147,461 133,901 23,232 10%476%
Total net sales.......................... $2,316,203 $2,362,886 $1,966,748 (2)% 20%
166