Logitech 2012 Annual Report Download - page 243
Download and view the complete annual report
Please find page 243 of the 2012 Logitech annual report below. You can navigate through the pages in the report by either clicking on the pages listed below, or by using the keyword search tool below to find specific information within the annual report.-
 1
1 -
2
-
3
-
4
-
5
-
6
-
7
-
8
-
9
-
10
-
11
-
12
-
13
-
14
-
15
-
16
-
17
-
18
-
19
-
20
-
21
-
22
-
23
-
24
-
25
-
26
-
27
-
28
-
29
-
30
-
31
-
32
-
33
-
34
-
35
-
36
-
37
-
38
-
39
-
40
-
41
-
42
-
43
-
44
-
45
-
46
-
47
-
48
-
49
-
50
-
51
-
52
-
53
-
54
-
55
-
56
-
57
-
58
-
59
-
60
-
61
-
62
-
63
-
64
-
65
-
66
-
67
-
68
-
69
-
70
-
71
-
72
-
73
-
74
-
75
-
76
-
77
-
78
-
79
-
80
-
81
-
82
-
83
-
84
-
85
-
86
-
87
-
88
-
89
-
90
-
91
-
92
-
93
-
94
-
95
-
96
-
97
-
98
-
99
-
100
-
101
-
102
-
103
-
104
-
105
-
106
-
107
-
108
-
109
-
110
-
111
-
112
-
113
-
114
-
115
-
116
-
117
-
118
-
119
-
120
-
121
-
122
-
123
-
124
-
125
-
126
-
127
-
128
-
129
-
130
-
131
-
132
-
133
-
134
-
135
-
136
-
137
-
138
-
139
-
140
-
141
-
142
-
143
-
144
-
145
-
146
-
147
-
148
-
149
-
150
-
151
-
152
-
153
-
154
-
155
-
156
-
157
-
158
-
159
-
160
-
161
-
162
-
163
-
164
-
165
-
166
-
167
-
168
-
169
-
170
-
171
-
172
-
173
-
174
-
175
-
176
-
177
-
178
-
179
-
180
-
181
-
182
-
183
-
184
-
185
-
186
-
187
-
188
-
189
-
190
-
191
-
192
-
193
-
194
-
195
-
196
-
197
-
198
-
199
-
200
-
201
-
202
-
203
-
204
-
205
-
206
-
207
-
208
-
209
-
210
-
211
-
212
-
213
-
214
-
215
-
216
-
217
-
218
-
219
-
220
-
221
-
222
-
223
-
224
-
225
-
226
-
227
-
228
-
229
-
230
-
231
-
232
-
 233
233 -
 234
234 -
 235
235 -
 236
236 -
 237
237 -
 238
238 -
 239
239 -
 240
240 -
 241
241 -
 242
242 -
 243
243 -
 244
244 -
 245
245 -
 246
246 -
 247
247 -
 248
248 -
 249
249 -
 250
250 -
 251
251 -
 252
252 -
 253
253 -
254
-
255
-
256
-
257
-
258
-
259
-
260
-
261
-
262
-
263
-
264
-
265
-
266
-
267
-
268
-
269
-
270
-
271
-
272
-
273
-
274
-
275
-
276
-
277
-
278
-
279
-
280
-
281
-
282
-
283
-
284
-
285
-
286
-
287
-
288
-
289
-
290
-
291
-
292
 |
 |

LOGITECH INTERNATIONAL S.A.
NOTES TO CONSOLIDATED FINANCIAL STATEMENTS (Continued)
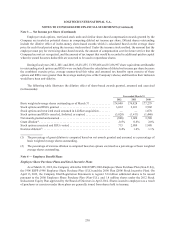
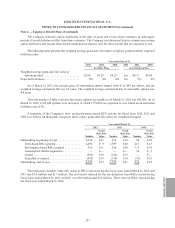
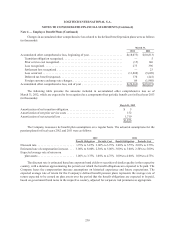
The Company estimates option forfeitures at the time of grant and revises those estimates in subsequent
periods if actual forfeitures differ from those estimates. The Company uses historical data to estimate pre-vesting
option forfeitures and records share-based compensation expense only for those awards that are expected to vest.
The following table presents the weighted average grant-date fair values of options granted and the expected
forfeiture rates:
Year ended March 31,
2012 2011 2010 2012 2011 2010
Purchase Plans Stock Option Plans
Weighted average grant-date fair value of
options granted . . . . . . . . . . . . . . . . . . . . . . . . . $2.96 $4.26 $4.23 n/a $6.11 $6.66
Expected forfeitures ........................ 0% 0% 0% n/a 9% 9%
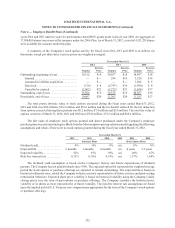
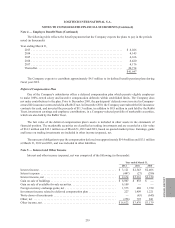
As of March 31, 2012, the exercise price of outstanding options ranged from $1 to $45 per option, and the
weighted average contractual life was 4.9 years. The weighted average contractual life of exercisable options was
4.4 years.
The total number of fully vested in-the-money options exercisable as of March 31, 2012 was 803,456. As of
March 31, 2012, 2,165,820 options were unvested, of which 1,970,896 are expected to vest, based on an estimated
forfeiture rate of 9%.
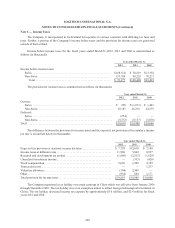
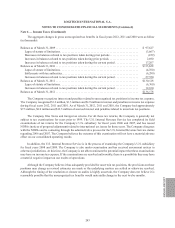
A summary of the Company’s time- and performance-based RSU activity for fiscal years 2012, 2011 and
2010 is as follows (in thousands, except per share values; grant-date fair values are weighted averages):
Year ended March 31,
2012 2011 2010
Number
Grant
Date Fair
Value Number
Grant
Date Fair
Value Number
Grant
Date Fair
Value
Outstanding, beginning of year................. 2,370 $ 21 514 $ 18 94 $ 28
Time-based RSUs granted .................. 2,496 $ 9 1,599 $ 20 267 $ 15
Performance-based RSUs granted ............ 516 $ 11 538 $ 28 115 $ 18
Assumed in LifeSize acquisition ............. — $ — — $ — 54 $ 5
Vested .................................. (399) $ 19 (142) $ 15 — $ —
Cancelled or expired....................... (858) $ 19 (139) $ 24 (16) $ 23
Outstanding, end of year . . . . . . . . . . . . . . . . . . . . . . 4,125 $ 13 2,370 $ 21 514 $ 18
The total pretax intrinsic value (fair value) of RSUs vested during the fiscal years ended March 31, 2012 and
2011 was $3.8 million and $1.7 million. The tax benefit realized for the tax deduction from RSUs vested during
fiscal years ended March 31, 2012 and 2011 was $0.9 million and $0.2 million. There were no RSUs vested during
the fiscal year ended March 31, 2010.
Note 4 — Employee Benefit Plans (Continued)
ANNUAL REPORT
233