Logitech 2012 Annual Report Download - page 242
Download and view the complete annual report
Please find page 242 of the 2012 Logitech annual report below. You can navigate through the pages in the report by either clicking on the pages listed below, or by using the keyword search tool below to find specific information within the annual report.-
 1
1 -
2
-
3
-
4
-
5
-
6
-
7
-
8
-
9
-
10
-
11
-
12
-
13
-
14
-
15
-
16
-
17
-
18
-
19
-
20
-
21
-
22
-
23
-
24
-
25
-
26
-
27
-
28
-
29
-
30
-
31
-
32
-
33
-
34
-
35
-
36
-
37
-
38
-
39
-
40
-
41
-
42
-
43
-
44
-
45
-
46
-
47
-
48
-
49
-
50
-
51
-
52
-
53
-
54
-
55
-
56
-
57
-
58
-
59
-
60
-
61
-
62
-
63
-
64
-
65
-
66
-
67
-
68
-
69
-
70
-
71
-
72
-
73
-
74
-
75
-
76
-
77
-
78
-
79
-
80
-
81
-
82
-
83
-
84
-
85
-
86
-
87
-
88
-
89
-
90
-
91
-
92
-
93
-
94
-
95
-
96
-
97
-
98
-
99
-
100
-
101
-
102
-
103
-
104
-
105
-
106
-
107
-
108
-
109
-
110
-
111
-
112
-
113
-
114
-
115
-
116
-
117
-
118
-
119
-
120
-
121
-
122
-
123
-
124
-
125
-
126
-
127
-
128
-
129
-
130
-
131
-
132
-
133
-
134
-
135
-
136
-
137
-
138
-
139
-
140
-
141
-
142
-
143
-
144
-
145
-
146
-
147
-
148
-
149
-
150
-
151
-
152
-
153
-
154
-
155
-
156
-
157
-
158
-
159
-
160
-
161
-
162
-
163
-
164
-
165
-
166
-
167
-
168
-
169
-
170
-
171
-
172
-
173
-
174
-
175
-
176
-
177
-
178
-
179
-
180
-
181
-
182
-
183
-
184
-
185
-
186
-
187
-
188
-
189
-
190
-
191
-
192
-
193
-
194
-
195
-
196
-
197
-
198
-
199
-
200
-
201
-
202
-
203
-
204
-
205
-
206
-
207
-
208
-
209
-
210
-
211
-
212
-
213
-
214
-
215
-
216
-
217
-
218
-
219
-
220
-
221
-
222
-
223
-
224
-
225
-
226
-
227
-
228
-
229
-
230
-
231
-
 232
232 -
 233
233 -
 234
234 -
 235
235 -
 236
236 -
 237
237 -
 238
238 -
 239
239 -
 240
240 -
 241
241 -
 242
242 -
 243
243 -
 244
244 -
 245
245 -
 246
246 -
 247
247 -
 248
248 -
 249
249 -
 250
250 -
 251
251 -
 252
252 -
253
-
254
-
255
-
256
-
257
-
258
-
259
-
260
-
261
-
262
-
263
-
264
-
265
-
266
-
267
-
268
-
269
-
270
-
271
-
272
-
273
-
274
-
275
-
276
-
277
-
278
-
279
-
280
-
281
-
282
-
283
-
284
-
285
-
286
-
287
-
288
-
289
-
290
-
291
-
292
 |
 |

LOGITECH INTERNATIONAL S.A.
NOTES TO CONSOLIDATED FINANCIAL STATEMENTS (Continued)
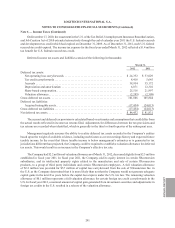
years 2012 and 2011 and two years for performance-based RSU grants made in fiscal year 2010. An aggregate of
17,500,000 shares was reserved for issuance under the 2006 Plan. As of March 31, 2012, a total of 4,331,255 shares
were available for issuance under this plan.
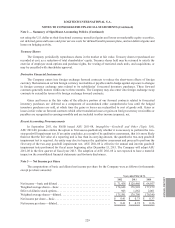
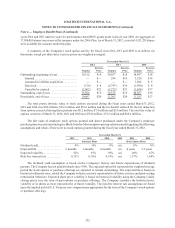
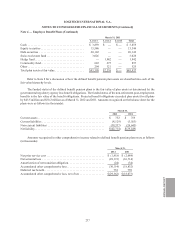
A summary of the Company’s stock option activity for fiscal years 2012, 2011 and 2010 is as follows (in
thousands, except per share data; exercise prices are weighted averages):
Year ended March 31,
2012 2011 2010
Number
Exercise
Price Number
Exercise
Price Number
Exercise
Price
Outstanding, beginning of year . . . . . . . . . . . . . 16,312 $19 20,037 $18 18,897 $18
Granted.............................. — $— 294 $16 3,520 $14
Assumed in LifeSize acquisition .......... — $— — $— 1,024 $ 5
Exercised ............................ (316) $ 8 (2,747) $10 (1,980) $ 8
Cancelled or expired ................... (2,962) $22 (1,272) $21 (1,424) $17
Outstanding, end of year. . . . . . . . . . . . . . . . . . . 13,034 $19 16,312 $19 20,037 $18
Exercisable, end of year . . . . . . . . . . . . . . . . . . . 10,867 $20 11,205 $20 11,287 $17
The total pretax intrinsic value of stock options exercised during the fiscal years ended March 31, 2012,
2011 and 2010 was $0.8 million, $23.9 million and $15.0 million and the tax benefit realized for the tax deduction
from options exercised during those periods was $0.2 million, $7.4 million and $3.9 million. The total fair value of
options vested as of March 31, 2012, 2011 and 2010 was $76.0 million, $74.3 million and $66.4 million.
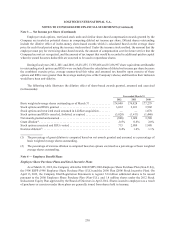
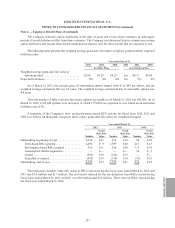
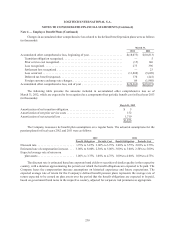
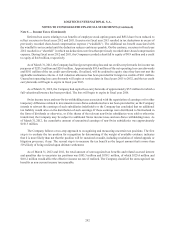
The fair value of employee stock options granted and shares purchased under the Company’s employee
purchase plans was estimated using the Black-Scholes-Merton option-pricing valuation model applying the following
assumptions and values. There were no stock options granted during the fiscal year ended March 31, 2012.
Year ended March 31,
2012 2011 2010 2012 2011 2010
Purchase Plans Stock Option Plans
Dividend yield ................ 0% 0% 0% n/a 0% 0%
Expected life ................. 6 months 6 months 6 months n/a 4 years 3.3 years
Expected volatility . . . . . . . . . . . . 52% 35% 59% n/a 48% 47%
Risk-free interest rate .......... 0.13% 0.16% 0.19% n/a 1.57% 1.64%
The dividend yield assumption is based on the Company’s history and future expectations of dividend
payouts. The Company has not paid dividends since 1996. The expected option life represents the weighted-average
period the stock options or purchase offerings are expected to remain outstanding. The expected life is based on
historical settlement rates, which the Company believes are most representative of future exercise and post-vesting
termination behaviors. Expected share price volatility is based on historical volatility using the Company’s daily
closing prices over the term of past options or purchase offerings. The Company considers the historical price
volatility of its shares as most representative of future volatility. The risk-free interest rate assumptions are based
upon the implied yield of U.S. Treasury zero-coupon issues appropriate for the term of the Company’s stock options
or purchase offerings.
Note 4 — Employee Benefit Plans (Continued)
232