Lenovo 2016 Annual Report Download - page 37
Download and view the complete annual report
Please find page 37 of the 2016 Lenovo annual report below. You can navigate through the pages in the report by either clicking on the pages listed below, or by using the keyword search tool below to find specific information within the annual report.-
 1
1 -
2
-
3
-
4
-
5
-
6
-
7
-
8
-
9
-
10
-
11
-
12
-
13
-
14
-
15
-
16
-
17
-
18
-
19
-
20
-
21
-
22
-
23
-
24
-
25
-
26
-
 27
27 -
 28
28 -
 29
29 -
 30
30 -
 31
31 -
 32
32 -
 33
33 -
 34
34 -
 35
35 -
 36
36 -
 37
37 -
 38
38 -
 39
39 -
 40
40 -
 41
41 -
 42
42 -
 43
43 -
 44
44 -
 45
45 -
 46
46 -
 47
47 -
48
-
49
-
50
-
51
-
52
-
53
-
54
-
55
-
56
-
57
-
58
-
59
-
60
-
61
-
62
-
63
-
64
-
65
-
66
-
67
-
68
-
69
-
70
-
71
-
72
-
73
-
74
-
75
-
76
-
77
-
78
-
79
-
80
-
81
-
82
-
83
-
84
-
85
-
86
-
87
-
88
-
89
-
90
-
91
-
92
-
93
-
94
-
95
-
96
-
97
-
98
-
99
-
100
-
101
-
102
-
103
-
104
-
105
-
106
-
107
-
108
-
109
-
110
-
111
-
112
-
113
-
114
-
115
-
116
-
117
-
118
-
119
-
120
-
121
-
122
-
123
-
124
-
125
-
126
-
127
-
128
-
129
-
130
-
131
-
132
-
133
-
134
-
135
-
136
-
137
-
138
-
139
-
140
-
141
-
142
-
143
-
144
-
145
-
146
-
147
-
148
-
149
-
150
-
151
-
152
-
153
-
154
-
155
-
156
-
157
-
158
-
159
-
160
-
161
-
162
-
163
-
164
-
165
-
166
-
167
-
168
-
169
-
170
-
171
-
172
-
173
-
174
-
175
-
176
-
177
-
178
-
179
-
180
-
181
-
182
-
183
-
184
-
185
-
186
-
187
-
188
-
189
-
190
-
191
-
192
-
193
-
194
-
195
-
196
-
197
-
198
-
199
-
200
-
201
-
202
-
203
-
204
-
205
-
206
-
207
-
208
-
209
-
210
-
211
-
212
-
213
-
214
-
215
-
216
-
217
-
218
-
219
-
220
-
221
-
222
-
223
-
224
-
225
-
226
-
227
-
228
-
229
-
230
-
231
-
232
-
233
-
234
-
235
-
236
-
237
-
238
-
239
-
240
-
241
-
242
-
243
-
244
-
245
-
246
-
247
 |
 |

35
2015/16 Annual Report Lenovo Group Limited
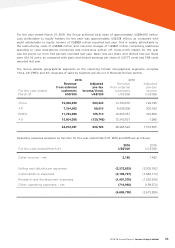
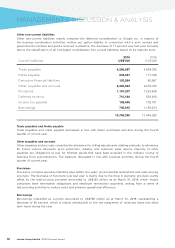
Finance income mainly represents interest on bank deposits.
Finance costs for the year increased by 28 percent as compared with last year. This is mainly attributable
to interest expense of US$27 million in relation to the 5-Year RMB4 billion notes, issued in June 2015,
bearing annual interest at 4.95% due in June 2020, and US$39 million notional interest expense (2015:
US$17 million) in relation to promissory note issued to Google Inc.
Share of losses of associates and joint ventures represents operating losses arising from principal business
activities of respective associates and joint ventures.
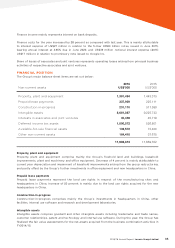
FINANCIAL POSITION
The Group’s major balance sheet items are set out below:
Non-current assets
2016
US$’000
2015
US$’000
Property, plant and equipment 1,391,494 1,443,313
Prepaid lease payments 337,929 225,111
Construction-in-progress 231,110 311,590
Intangible assets 8,661,087 9,225,743
Interests in associates and joint ventures 40,439 45,719
Deferred income tax assets 1,000,572 526,801
Available-for-sale financial assets 139,572 73,400
Other non-current assets 164,410 37,675
11,966,613 11,889,352
Property, plant and equipment
Property, plant and equipment comprise mainly the Group’s freehold land and buildings, leasehold
improvements, plant and machinery and office equipment. Decrease of 4 percent is mainly attributable to
current year depreciation and impairment of leasehold improvements arising from the group restructuring,
and partly offset by the Group’s further investments in office equipment and new headquarters in China.
Prepaid lease payments
Prepaid lease payments represent the land use rights in respect of the manufacturing sites and
headquarters in China. Increase of 50 percent is mainly due to the land use rights acquired for the new
headquarters in China.
Construction-in-progress
Construction-in-progress comprises mainly the Group’s investments in headquarters in China, other
facilities, internal use software and research and development laboratories.
Intangible assets
Intangible assets comprise goodwill and other intangible assets including trademarks and trade names,
customer relationships, patent and technology and internal use software. During the year, the Group has
finalized the fair value assessments for the net assets acquired from the business combination activities in
FY2014/15.