Lenovo 2016 Annual Report Download - page 189
Download and view the complete annual report
Please find page 189 of the 2016 Lenovo annual report below. You can navigate through the pages in the report by either clicking on the pages listed below, or by using the keyword search tool below to find specific information within the annual report.-
 1
1 -
2
-
3
-
4
-
5
-
6
-
7
-
8
-
9
-
10
-
11
-
12
-
13
-
14
-
15
-
16
-
17
-
18
-
19
-
20
-
21
-
22
-
23
-
24
-
25
-
26
-
27
-
28
-
29
-
30
-
31
-
32
-
33
-
34
-
35
-
36
-
37
-
38
-
39
-
40
-
41
-
42
-
43
-
44
-
45
-
46
-
47
-
48
-
49
-
50
-
51
-
52
-
53
-
54
-
55
-
56
-
57
-
58
-
59
-
60
-
61
-
62
-
63
-
64
-
65
-
66
-
67
-
68
-
69
-
70
-
71
-
72
-
73
-
74
-
75
-
76
-
77
-
78
-
79
-
80
-
81
-
82
-
83
-
84
-
85
-
86
-
87
-
88
-
89
-
90
-
91
-
92
-
93
-
94
-
95
-
96
-
97
-
98
-
99
-
100
-
101
-
102
-
103
-
104
-
105
-
106
-
107
-
108
-
109
-
110
-
111
-
112
-
113
-
114
-
115
-
116
-
117
-
118
-
119
-
120
-
121
-
122
-
123
-
124
-
125
-
126
-
127
-
128
-
129
-
130
-
131
-
132
-
133
-
134
-
135
-
136
-
137
-
138
-
139
-
140
-
141
-
142
-
143
-
144
-
145
-
146
-
147
-
148
-
149
-
150
-
151
-
152
-
153
-
154
-
155
-
156
-
157
-
158
-
159
-
160
-
161
-
162
-
163
-
164
-
165
-
166
-
167
-
168
-
169
-
170
-
171
-
172
-
173
-
174
-
175
-
176
-
177
-
178
-
 179
179 -
 180
180 -
 181
181 -
 182
182 -
 183
183 -
 184
184 -
 185
185 -
 186
186 -
 187
187 -
 188
188 -
 189
189 -
 190
190 -
 191
191 -
 192
192 -
 193
193 -
 194
194 -
 195
195 -
 196
196 -
 197
197 -
 198
198 -
 199
199 -
200
-
201
-
202
-
203
-
204
-
205
-
206
-
207
-
208
-
209
-
210
-
211
-
212
-
213
-
214
-
215
-
216
-
217
-
218
-
219
-
220
-
221
-
222
-
223
-
224
-
225
-
226
-
227
-
228
-
229
-
230
-
231
-
232
-
233
-
234
-
235
-
236
-
237
-
238
-
239
-
240
-
241
-
242
-
243
-
244
-
245
-
246
-
247
 |
 |

187
2015/16 Annual Report Lenovo Group Limited
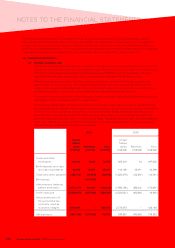
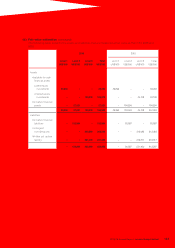
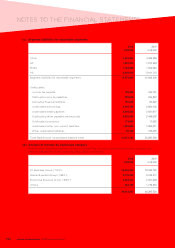
3 FINANCIAL RISK MANAGEMENT (continued)
(d) Fair value estimation (continued)
The following table presents the assets and liabilities that are measured at fair value at March 31, 2016 and
2015.
2016 2015
Level 1
US$’000
Level 2
US$’000
Level 3
US$’000
Total
US$’000
Level 1
US$’000
Level 2
US$’000
Level 3
US$’000
Total
US$’000
Assets
Available-for-sale
financial assets
Listed equity
investments 39,294 – – 39,294 39,292 – – 39,292
Unlisted equity
investments – – 100,278 100,278 – – 34,108 34,108
Derivative financial
assets –27,021 –27,021 –184,534 –184,534
39,294 27,021 100,278 166,593 39,292 184,534 34,108 257,934
Liabilities
Derivative financial
liabilities –150,864 –150,864 –80,897 –80,897
Contingent
considerations – – 260,590 260,590 – – 312,083 312,083
Written put option
liability – – 221,499 221,499 – – 219,317 219,317
–150,864 482,089 632,953 –80,897 531,400 612,297