Lenovo 2016 Annual Report Download - page 111
Download and view the complete annual report
Please find page 111 of the 2016 Lenovo annual report below. You can navigate through the pages in the report by either clicking on the pages listed below, or by using the keyword search tool below to find specific information within the annual report.-
 1
1 -
2
-
3
-
4
-
5
-
6
-
7
-
8
-
9
-
10
-
11
-
12
-
13
-
14
-
15
-
16
-
17
-
18
-
19
-
20
-
21
-
22
-
23
-
24
-
25
-
26
-
27
-
28
-
29
-
30
-
31
-
32
-
33
-
34
-
35
-
36
-
37
-
38
-
39
-
40
-
41
-
42
-
43
-
44
-
45
-
46
-
47
-
48
-
49
-
50
-
51
-
52
-
53
-
54
-
55
-
56
-
57
-
58
-
59
-
60
-
61
-
62
-
63
-
64
-
65
-
66
-
67
-
68
-
69
-
70
-
71
-
72
-
73
-
74
-
75
-
76
-
77
-
78
-
79
-
80
-
81
-
82
-
83
-
84
-
85
-
86
-
87
-
88
-
89
-
90
-
91
-
92
-
93
-
94
-
95
-
96
-
97
-
98
-
99
-
100
-
 101
101 -
 102
102 -
 103
103 -
 104
104 -
 105
105 -
 106
106 -
 107
107 -
 108
108 -
 109
109 -
 110
110 -
 111
111 -
 112
112 -
 113
113 -
 114
114 -
 115
115 -
 116
116 -
 117
117 -
 118
118 -
 119
119 -
 120
120 -
 121
121 -
122
-
123
-
124
-
125
-
126
-
127
-
128
-
129
-
130
-
131
-
132
-
133
-
134
-
135
-
136
-
137
-
138
-
139
-
140
-
141
-
142
-
143
-
144
-
145
-
146
-
147
-
148
-
149
-
150
-
151
-
152
-
153
-
154
-
155
-
156
-
157
-
158
-
159
-
160
-
161
-
162
-
163
-
164
-
165
-
166
-
167
-
168
-
169
-
170
-
171
-
172
-
173
-
174
-
175
-
176
-
177
-
178
-
179
-
180
-
181
-
182
-
183
-
184
-
185
-
186
-
187
-
188
-
189
-
190
-
191
-
192
-
193
-
194
-
195
-
196
-
197
-
198
-
199
-
200
-
201
-
202
-
203
-
204
-
205
-
206
-
207
-
208
-
209
-
210
-
211
-
212
-
213
-
214
-
215
-
216
-
217
-
218
-
219
-
220
-
221
-
222
-
223
-
224
-
225
-
226
-
227
-
228
-
229
-
230
-
231
-
232
-
233
-
234
-
235
-
236
-
237
-
238
-
239
-
240
-
241
-
242
-
243
-
244
-
245
-
246
-
247
 |
 |

109
2015/16 Annual Report Lenovo Group Limited
COMPENSATION POLICY
Overall Principles
Lenovo recognizes the importance of attracting and retaining top-caliber talent and is strongly committed
to effective corporate governance. Consistent with this philosophy, the Company has a formal, transparent
and performance-driven compensation policy covering its directors, senior management and general
employees.
Generally, Lenovo’s compensation serves to support the Company’s business strategy, assist the attraction
and retention of top talent, reinforce the Company’s performance driven culture, and in the meanwhile
reflect market practices of other leading international IT enterprises, with particular focus on Lenovo’s
closest competitors.
The Committee makes regular reviews of Lenovo’s compensation practices to ensure they reflect the
overall principles and objectives stated above.
Non-executive Directors
The Committee regularly reviews the compensation of Non-executive Directors to ensure its
appropriateness considering the Non-executive Directors’ time commitment, workload, job requirements
and responsibilities versus Lenovo’s peer companies and the broader market. Details of the current
package and the review carried out in this fiscal year are set out in the section headed “Remuneration
Reviews” below.
Chairman/CEO and Senior Management
To ensure Lenovo’s compensation for the Chairman/CEO and senior management reflect the policy and
principles described above, the Committee considers a number of relevant factors in the determination
of their compensation. Such factors include: salaries and total compensation paid by peer companies,
job responsibilities and scope, employment conditions elsewhere in the Company, market practices, the
Company’s business performance and individual performance.
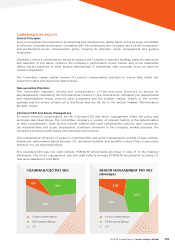
The compensation structure of Lenovo’s Chairman/CEO and senior management consists of base salaries,
allowances, performance-based bonuses, LTI, retirement benefits, and benefits-in-kind. These components
and their mix are described below.
The Chairman/CEO pay mix chart reflects FY2015/16 emoluments disclosed in note 11 to the financial
statements. The senior management pay mix chart reflects average FY2015/16 emoluments including LTI
that were awarded in June 2015.
CHAIRMAN/CEO PAY MIX SENIOR MANAGEMENT PAY MIX
(Average)
Fixed Compensation
Performance Bonus
LTI
Fixed Compensation
Performance Bonus
LTI
8%21%
34%
43%
58%36%