Lenovo 2016 Annual Report Download - page 22
Download and view the complete annual report
Please find page 22 of the 2016 Lenovo annual report below. You can navigate through the pages in the report by either clicking on the pages listed below, or by using the keyword search tool below to find specific information within the annual report.-
 1
1 -
2
-
3
-
4
-
5
-
6
-
7
-
8
-
9
-
10
-
11
-
 12
12 -
 13
13 -
 14
14 -
 15
15 -
 16
16 -
 17
17 -
 18
18 -
 19
19 -
 20
20 -
 21
21 -
 22
22 -
 23
23 -
 24
24 -
 25
25 -
 26
26 -
 27
27 -
 28
28 -
 29
29 -
 30
30 -
 31
31 -
 32
32 -
33
-
34
-
35
-
36
-
37
-
38
-
39
-
40
-
41
-
42
-
43
-
44
-
45
-
46
-
47
-
48
-
49
-
50
-
51
-
52
-
53
-
54
-
55
-
56
-
57
-
58
-
59
-
60
-
61
-
62
-
63
-
64
-
65
-
66
-
67
-
68
-
69
-
70
-
71
-
72
-
73
-
74
-
75
-
76
-
77
-
78
-
79
-
80
-
81
-
82
-
83
-
84
-
85
-
86
-
87
-
88
-
89
-
90
-
91
-
92
-
93
-
94
-
95
-
96
-
97
-
98
-
99
-
100
-
101
-
102
-
103
-
104
-
105
-
106
-
107
-
108
-
109
-
110
-
111
-
112
-
113
-
114
-
115
-
116
-
117
-
118
-
119
-
120
-
121
-
122
-
123
-
124
-
125
-
126
-
127
-
128
-
129
-
130
-
131
-
132
-
133
-
134
-
135
-
136
-
137
-
138
-
139
-
140
-
141
-
142
-
143
-
144
-
145
-
146
-
147
-
148
-
149
-
150
-
151
-
152
-
153
-
154
-
155
-
156
-
157
-
158
-
159
-
160
-
161
-
162
-
163
-
164
-
165
-
166
-
167
-
168
-
169
-
170
-
171
-
172
-
173
-
174
-
175
-
176
-
177
-
178
-
179
-
180
-
181
-
182
-
183
-
184
-
185
-
186
-
187
-
188
-
189
-
190
-
191
-
192
-
193
-
194
-
195
-
196
-
197
-
198
-
199
-
200
-
201
-
202
-
203
-
204
-
205
-
206
-
207
-
208
-
209
-
210
-
211
-
212
-
213
-
214
-
215
-
216
-
217
-
218
-
219
-
220
-
221
-
222
-
223
-
224
-
225
-
226
-
227
-
228
-
229
-
230
-
231
-
232
-
233
-
234
-
235
-
236
-
237
-
238
-
239
-
240
-
241
-
242
-
243
-
244
-
245
-
246
-
247
 |
 |

20 Lenovo Group Limited 2015/16 Annual Report
MANAGEMENT’S DISCUSSION & ANALYSIS
For the fiscal year ended March 31, 2016, revenue of the Enterprise business was US$4,553 million, an
increase of 73 percent year-on-year, representing approximately 10 percent of the Group’s total revenue.
Its China business remained strong and revenue was up 76 percent year-on-year driven by the hyperscale
success. The enterprise business recorded operational profit before the non-cash M&A related accounting
charges of US$53 million with margin of 1.2 percent, against loss of US$29 million and negative 1.1 percent
margin in last fiscal year. The Group achieved operational profitability with margin improvement for the
sixth consecutive quarter since the acquisition closed.
Nevertheless, integration of System X business is taking longer than expected due to slower market
growth affected by the macro economy. While the Group has had solid results in China and Emerging
Markets, it is building confidence and driving better results in the U.S. and Western Europe. There were
also some wins of the Group in the pipeline that were not yet reflected in the fiscal quarter four but will
benefit revenue growth in future quarters. And these resulted in a slower than expected revenue growth
for the Group in the fiscal quarter four.
Ecosystem and Cloud Services Business Group (ECS) and Others
The Group continued to build a solid foundation for its ecosystem business during the period under
review, with an objective to create a better user experience for Lenovo’s product users. The ECS team
continued to demonstrate strong achievements during the fiscal year and its monthly active user base
number exceeded 200 million.
Revenue from ECS and other products such as consumer electronic businesses from previous acquisitions
was US$934 million, representing approximately 2 percent of the Group’s total revenue.
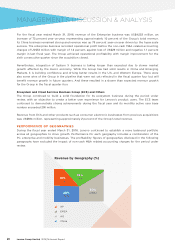
PERFORMANCE OF GEOGRAPHIES
During the fiscal year ended March 31, 2016, Lenovo continued to establish a more balanced portfolio
across all geographies to drive growth. Performance for each geography includes a combination of the
PC, enterprise and mobility businesses. The profitability figures of geographies disclosed in the following
paragraphs have excluded the impact of non-cash M&A related accounting charges for the period under
review.
Revenue by Geography (%)
16% 26%
(28%)
(26%)
(32%)
(14%)
30%
28%
AP
EMEA
AG
China