Lenovo 2016 Annual Report Download - page 226
Download and view the complete annual report
Please find page 226 of the 2016 Lenovo annual report below. You can navigate through the pages in the report by either clicking on the pages listed below, or by using the keyword search tool below to find specific information within the annual report.-
 1
1 -
2
-
3
-
4
-
5
-
6
-
7
-
8
-
9
-
10
-
11
-
12
-
13
-
14
-
15
-
16
-
17
-
18
-
19
-
20
-
21
-
22
-
23
-
24
-
25
-
26
-
27
-
28
-
29
-
30
-
31
-
32
-
33
-
34
-
35
-
36
-
37
-
38
-
39
-
40
-
41
-
42
-
43
-
44
-
45
-
46
-
47
-
48
-
49
-
50
-
51
-
52
-
53
-
54
-
55
-
56
-
57
-
58
-
59
-
60
-
61
-
62
-
63
-
64
-
65
-
66
-
67
-
68
-
69
-
70
-
71
-
72
-
73
-
74
-
75
-
76
-
77
-
78
-
79
-
80
-
81
-
82
-
83
-
84
-
85
-
86
-
87
-
88
-
89
-
90
-
91
-
92
-
93
-
94
-
95
-
96
-
97
-
98
-
99
-
100
-
101
-
102
-
103
-
104
-
105
-
106
-
107
-
108
-
109
-
110
-
111
-
112
-
113
-
114
-
115
-
116
-
117
-
118
-
119
-
120
-
121
-
122
-
123
-
124
-
125
-
126
-
127
-
128
-
129
-
130
-
131
-
132
-
133
-
134
-
135
-
136
-
137
-
138
-
139
-
140
-
141
-
142
-
143
-
144
-
145
-
146
-
147
-
148
-
149
-
150
-
151
-
152
-
153
-
154
-
155
-
156
-
157
-
158
-
159
-
160
-
161
-
162
-
163
-
164
-
165
-
166
-
167
-
168
-
169
-
170
-
171
-
172
-
173
-
174
-
175
-
176
-
177
-
178
-
179
-
180
-
181
-
182
-
183
-
184
-
185
-
186
-
187
-
188
-
189
-
190
-
191
-
192
-
193
-
194
-
195
-
196
-
197
-
198
-
199
-
200
-
201
-
202
-
203
-
204
-
205
-
206
-
207
-
208
-
209
-
210
-
211
-
212
-
213
-
214
-
215
-
 216
216 -
 217
217 -
 218
218 -
 219
219 -
 220
220 -
 221
221 -
 222
222 -
 223
223 -
 224
224 -
 225
225 -
 226
226 -
 227
227 -
 228
228 -
 229
229 -
 230
230 -
 231
231 -
 232
232 -
 233
233 -
 234
234 -
 235
235 -
 236
236 -
237
-
238
-
239
-
240
-
241
-
242
-
243
-
244
-
245
-
246
-
247
 |
 |

224 Lenovo Group Limited 2015/16 Annual Report
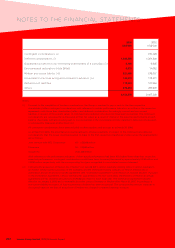
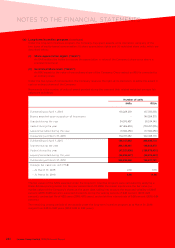
NOTES TO THE FINANCIAL STATEMENTS
29 SHARE CAPITAL (continued)
(a) Long-term incentive program (continued)
Under the long-term incentive program, the Company may grant awards, at its discretion, using any of the
two types of equity-based compensation: (i) share appreciation rights and (ii) restricted share units, which are
described below:
(i) Share Appreciation Rights (“SARs”)
An SAR entitles the holder to receive the appreciation in value of the Company’s share price above a
predetermined level.
(ii) Restricted Share Units (“RSUs”)
An RSU equals to the value of one ordinary share of the Company. Once vested, an RSU is converted to
an ordinary share.
Under the two types of compensation, the Company reserves the right, at its discretion, to settle the award in
cash or ordinary shares of the Company.
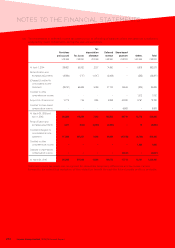
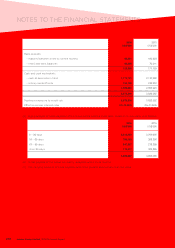
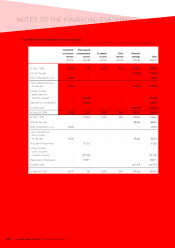
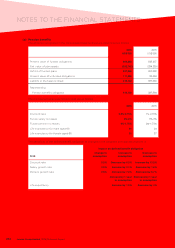
Movements in the number of units of award granted during the year and their related weighted average fair
values are as follows:
Number of units
SARs RSUs
Outstanding at April 1, 2014 103,228,268 137,503,393
Shares awarded upon acquisition of businesses –146,594,218
Granted during the year 84,979,487 90,514,143
Vested during the year (47,499,634) (134,431,685)
Lapsed/cancelled during the year (6,600,459) (17,684,353)
Outstanding at March 31, 2015 134,107,662 222,495,716
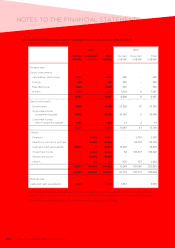
Outstanding at April 1, 2015 134,107,662 222,495,716
Granted during the year 224,120,431 148,608,870
Vested during the year (47,321,938) (126,670,401)
Lapsed/cancelled during the year (24,683,597) (58,002,454)
Outstanding at March 31, 2016 286,222,558 186,431,731
Average fair value per unit (HK$)
– At March 31, 2015 2.39 9.73
– At March 31, 2016 2.08 11.06
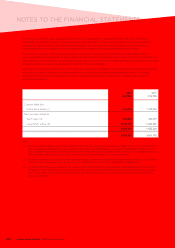
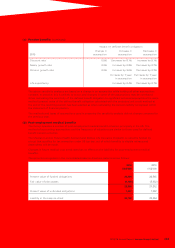
The fair values of the SARs awarded under the long-term incentive program were calculated by applying a
Black-Scholes pricing model. For the year ended March 31, 2016, the model inputs were the fair value (i.e.
market value) of the Company’s shares at the grant date, taking into account the expected volatility of 36.07
percent (2015: 34.48 percent), expected dividends during the vesting periods of 2.43 percent (2015: 2.23
percent), contractual life of 4.25 years (2015: 4.75 years), and a risk-free interest rate of 0.56 percent (2015: 0.64
percent).
The remaining vesting periods of the awards under the long-term incentive program as at March 31, 2016
ranged from 0.08 to 3.92 years (2015: 0.08 to 3.92 years).