Lenovo 2016 Annual Report Download - page 23
Download and view the complete annual report
Please find page 23 of the 2016 Lenovo annual report below. You can navigate through the pages in the report by either clicking on the pages listed below, or by using the keyword search tool below to find specific information within the annual report.-
 1
1 -
2
-
3
-
4
-
5
-
6
-
7
-
8
-
9
-
10
-
11
-
12
-
 13
13 -
 14
14 -
 15
15 -
 16
16 -
 17
17 -
 18
18 -
 19
19 -
 20
20 -
 21
21 -
 22
22 -
 23
23 -
 24
24 -
 25
25 -
 26
26 -
 27
27 -
 28
28 -
 29
29 -
 30
30 -
 31
31 -
 32
32 -
 33
33 -
34
-
35
-
36
-
37
-
38
-
39
-
40
-
41
-
42
-
43
-
44
-
45
-
46
-
47
-
48
-
49
-
50
-
51
-
52
-
53
-
54
-
55
-
56
-
57
-
58
-
59
-
60
-
61
-
62
-
63
-
64
-
65
-
66
-
67
-
68
-
69
-
70
-
71
-
72
-
73
-
74
-
75
-
76
-
77
-
78
-
79
-
80
-
81
-
82
-
83
-
84
-
85
-
86
-
87
-
88
-
89
-
90
-
91
-
92
-
93
-
94
-
95
-
96
-
97
-
98
-
99
-
100
-
101
-
102
-
103
-
104
-
105
-
106
-
107
-
108
-
109
-
110
-
111
-
112
-
113
-
114
-
115
-
116
-
117
-
118
-
119
-
120
-
121
-
122
-
123
-
124
-
125
-
126
-
127
-
128
-
129
-
130
-
131
-
132
-
133
-
134
-
135
-
136
-
137
-
138
-
139
-
140
-
141
-
142
-
143
-
144
-
145
-
146
-
147
-
148
-
149
-
150
-
151
-
152
-
153
-
154
-
155
-
156
-
157
-
158
-
159
-
160
-
161
-
162
-
163
-
164
-
165
-
166
-
167
-
168
-
169
-
170
-
171
-
172
-
173
-
174
-
175
-
176
-
177
-
178
-
179
-
180
-
181
-
182
-
183
-
184
-
185
-
186
-
187
-
188
-
189
-
190
-
191
-
192
-
193
-
194
-
195
-
196
-
197
-
198
-
199
-
200
-
201
-
202
-
203
-
204
-
205
-
206
-
207
-
208
-
209
-
210
-
211
-
212
-
213
-
214
-
215
-
216
-
217
-
218
-
219
-
220
-
221
-
222
-
223
-
224
-
225
-
226
-
227
-
228
-
229
-
230
-
231
-
232
-
233
-
234
-
235
-
236
-
237
-
238
-
239
-
240
-
241
-
242
-
243
-
244
-
245
-
246
-
247
 |
 |

21
2015/16 Annual Report Lenovo Group Limited
China
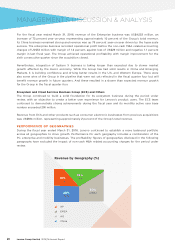
China accounted for 28 percent of the Group’s total revenue. The Group maintained its strong number
one position in China PC market with record market share of 36.5 percent for the fiscal year, according to
industry estimates, and continued to protect its profitability by leveraging its leadership position despite
the market challenges.
The competition in China smartphone market remained very keen while demand turned softer due to the
economy. The Group has taken actions to strengthen its open channel partnership and brand strategy and
to shift its product portfolio towards higher average selling price in order to turnaround its China business
over time.
During the fiscal year under review, the Group’s enterprise business continued to grow rapidly with strong
revenue performance driven by sales to the hyperscale customers. Its revenue grew strongly by 76 percent
year-on-year, and remained the strong number one with a 22.7 percent unit market share, continued to
grow faster than the market.
Profit before taxation was US$563 million and pre-tax margin was 4.6 percent, a decline of 0.8 percentage
points year-on-year due to the smartphone business transformation.
Americas (AG)
Americas accounted for 30 percent of the Group’s total revenue. The Group’s PC unit shipments in AG
increased by 6 percent year-on-year, outperforming the market by a 16-point premium. The Group’s AG
market share increased by 2.0 percentage points from a year ago to a record 13.7 percent, according to
preliminary industry estimates. The solid performance was driven by the strong growth of its PC unit
shipments in the U.S., which grew by 19 percent year-on-year against a market decline of 4 percent. This
brought its U.S. market share to 13.2 percent for the fiscal year, up 2.5 percentage points year-on-year.
The Group continued to pave the foundation for its smartphone business in the fiscal year to drive future
growth. However, it experienced a slower-than-expected product transition that it missed a key window of
opportunity during the fiscal quarter four in North America which affected the performance in the quarter.
For enterprise business, the Group was still building the confidence and driving better results in U.S.
The Group recorded a loss before taxation of US$121 million in the region, versus a profit before
taxation of US$8 million recorded last year, and its pre-tax margin was negative 0.9 percent. The decline
in profitability was largely due to the inclusion of full-year Motorola Mobility business and efforts to
strengthen the quality of our smartphone business in the region.
Asia Pacific (AP)
Asia Pacific accounted for 16 percent of the Group’s total revenue. The Group’s PC shipments grew at a
10-point premium to the market during the fiscal year and it became number one in AP with market share
increased by 1.7 percentage points year-on-year, to a record 17.5 percent for the fiscal year, according to
preliminary industry estimates.
The Group also achieved strong shipment growth in smartphones during the fiscal year, growing 96
percent year-on-year for the fiscal year, with particularly strong momentum in ASEAN countries and in
India. The Group continued to leverage its channel expertise and ecosystem to accelerate its Enterprise
business in AP.
Profit before taxation was US$89 million and pre-tax margin was 1.2 percent, versus 4.6 percent last year,
mainly due to the inclusion of full-year Motorola Mobility business, contraction in Japan PC market and
impact from currency fluctuation.