Lenovo 2016 Annual Report Download - page 210
Download and view the complete annual report
Please find page 210 of the 2016 Lenovo annual report below. You can navigate through the pages in the report by either clicking on the pages listed below, or by using the keyword search tool below to find specific information within the annual report.-
 1
1 -
2
-
3
-
4
-
5
-
6
-
7
-
8
-
9
-
10
-
11
-
12
-
13
-
14
-
15
-
16
-
17
-
18
-
19
-
20
-
21
-
22
-
23
-
24
-
25
-
26
-
27
-
28
-
29
-
30
-
31
-
32
-
33
-
34
-
35
-
36
-
37
-
38
-
39
-
40
-
41
-
42
-
43
-
44
-
45
-
46
-
47
-
48
-
49
-
50
-
51
-
52
-
53
-
54
-
55
-
56
-
57
-
58
-
59
-
60
-
61
-
62
-
63
-
64
-
65
-
66
-
67
-
68
-
69
-
70
-
71
-
72
-
73
-
74
-
75
-
76
-
77
-
78
-
79
-
80
-
81
-
82
-
83
-
84
-
85
-
86
-
87
-
88
-
89
-
90
-
91
-
92
-
93
-
94
-
95
-
96
-
97
-
98
-
99
-
100
-
101
-
102
-
103
-
104
-
105
-
106
-
107
-
108
-
109
-
110
-
111
-
112
-
113
-
114
-
115
-
116
-
117
-
118
-
119
-
120
-
121
-
122
-
123
-
124
-
125
-
126
-
127
-
128
-
129
-
130
-
131
-
132
-
133
-
134
-
135
-
136
-
137
-
138
-
139
-
140
-
141
-
142
-
143
-
144
-
145
-
146
-
147
-
148
-
149
-
150
-
151
-
152
-
153
-
154
-
155
-
156
-
157
-
158
-
159
-
160
-
161
-
162
-
163
-
164
-
165
-
166
-
167
-
168
-
169
-
170
-
171
-
172
-
173
-
174
-
175
-
176
-
177
-
178
-
179
-
180
-
181
-
182
-
183
-
184
-
185
-
186
-
187
-
188
-
189
-
190
-
191
-
192
-
193
-
194
-
195
-
196
-
197
-
198
-
199
-
 200
200 -
 201
201 -
 202
202 -
 203
203 -
 204
204 -
 205
205 -
 206
206 -
 207
207 -
 208
208 -
 209
209 -
 210
210 -
 211
211 -
 212
212 -
 213
213 -
 214
214 -
 215
215 -
 216
216 -
 217
217 -
 218
218 -
 219
219 -
 220
220 -
221
-
222
-
223
-
224
-
225
-
226
-
227
-
228
-
229
-
230
-
231
-
232
-
233
-
234
-
235
-
236
-
237
-
238
-
239
-
240
-
241
-
242
-
243
-
244
-
245
-
246
-
247
 |
 |

208 Lenovo Group Limited 2015/16 Annual Report
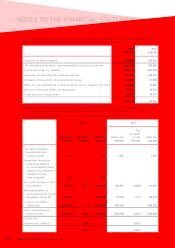
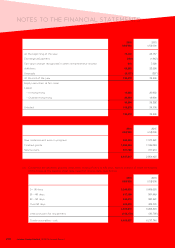
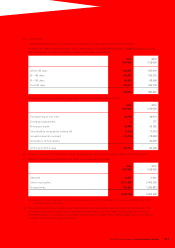
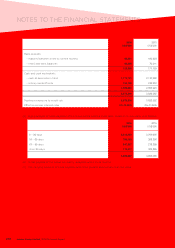
NOTES TO THE FINANCIAL STATEMENTS
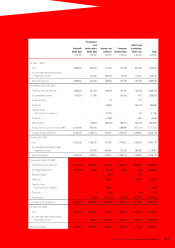
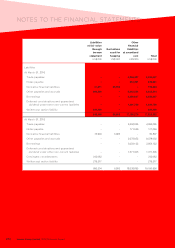
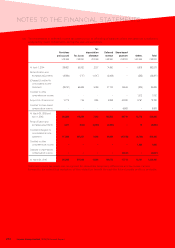
17 INTANGIBLE ASSETS (continued)
(a) (continued)
Amortization of US$42,427,000 (2015: US$12,503,000), US$8,407,000 (2015: US$8,562,000), US$330,915,000
(2015: US$221,967,000) and US$92,752,000 (2015: US$57,348,000) are included in the ‘cost of sales’, ‘selling and
distribution expenses’, ‘administrative expenses’ and ‘research and development expenses’ in the consolidated
income statement respectively.
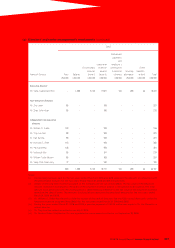
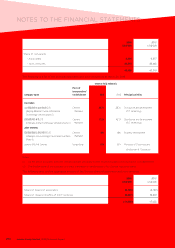
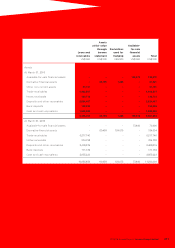
(b) Impairment tests for goodwill and intangible assets with indefinite useful lives
The carrying amounts of goodwill and trademarks and trade names with indefinite useful lives are presented
below:
China
US$ million
AP
US$ million
EMEA
US$ million
AG
US$ million
Total
US$ million
At March 31, 2016
Goodwill
– PCG 1,085 549 233 326 2,193
– MBG –314 362 926 1,602
– EBG 484 162 92 366 1,104
Trademarks and trade names
– PCG 211 59 103 69 442
– MBG –90 104 266 460
– EBG 162 54 31 123 370
China
US$ million
AP
US$ million
EMEA
US$ million
AG
US$ million
Amounts
pending
allocation
US$ million
Total
US$ million
At March 31, 2015
Goodwill 1,128 521 216 336 3,019 5,220
Trademarks and trade names 209 59 102 67 847 1,284
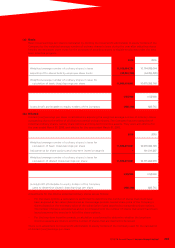
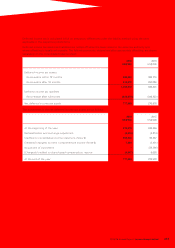
The Group completed its annual impairment test for goodwill allocated to the Group’s various CGUs by
comparing their recoverable amounts to their carrying amounts as at the reporting date. The recoverable
amount of a CGU is determined based on value in use. These assessments use pre-tax cash flow projections
based on financial budgets approved by management covering a five-year period with a terminal value
related to the future cash flow of the CGU extrapolated using constant projection of cash flows beyond the
five-year period. The estimated growth rates adopted do not exceed the long-term average growth rates for
the businesses in which the CGU operates.