Lenovo 2016 Annual Report Download - page 239
Download and view the complete annual report
Please find page 239 of the 2016 Lenovo annual report below. You can navigate through the pages in the report by either clicking on the pages listed below, or by using the keyword search tool below to find specific information within the annual report.-
 1
1 -
2
-
3
-
4
-
5
-
6
-
7
-
8
-
9
-
10
-
11
-
12
-
13
-
14
-
15
-
16
-
17
-
18
-
19
-
20
-
21
-
22
-
23
-
24
-
25
-
26
-
27
-
28
-
29
-
30
-
31
-
32
-
33
-
34
-
35
-
36
-
37
-
38
-
39
-
40
-
41
-
42
-
43
-
44
-
45
-
46
-
47
-
48
-
49
-
50
-
51
-
52
-
53
-
54
-
55
-
56
-
57
-
58
-
59
-
60
-
61
-
62
-
63
-
64
-
65
-
66
-
67
-
68
-
69
-
70
-
71
-
72
-
73
-
74
-
75
-
76
-
77
-
78
-
79
-
80
-
81
-
82
-
83
-
84
-
85
-
86
-
87
-
88
-
89
-
90
-
91
-
92
-
93
-
94
-
95
-
96
-
97
-
98
-
99
-
100
-
101
-
102
-
103
-
104
-
105
-
106
-
107
-
108
-
109
-
110
-
111
-
112
-
113
-
114
-
115
-
116
-
117
-
118
-
119
-
120
-
121
-
122
-
123
-
124
-
125
-
126
-
127
-
128
-
129
-
130
-
131
-
132
-
133
-
134
-
135
-
136
-
137
-
138
-
139
-
140
-
141
-
142
-
143
-
144
-
145
-
146
-
147
-
148
-
149
-
150
-
151
-
152
-
153
-
154
-
155
-
156
-
157
-
158
-
159
-
160
-
161
-
162
-
163
-
164
-
165
-
166
-
167
-
168
-
169
-
170
-
171
-
172
-
173
-
174
-
175
-
176
-
177
-
178
-
179
-
180
-
181
-
182
-
183
-
184
-
185
-
186
-
187
-
188
-
189
-
190
-
191
-
192
-
193
-
194
-
195
-
196
-
197
-
198
-
199
-
200
-
201
-
202
-
203
-
204
-
205
-
206
-
207
-
208
-
209
-
210
-
211
-
212
-
213
-
214
-
215
-
216
-
217
-
218
-
219
-
220
-
221
-
222
-
223
-
224
-
225
-
226
-
227
-
228
-
 229
229 -
 230
230 -
 231
231 -
 232
232 -
 233
233 -
 234
234 -
 235
235 -
 236
236 -
 237
237 -
 238
238 -
 239
239 -
 240
240 -
 241
241 -
 242
242 -
 243
243 -
 244
244 -
 245
245 -
 246
246 -
 247
247
 |
 |

237
2015/16 Annual Report Lenovo Group Limited
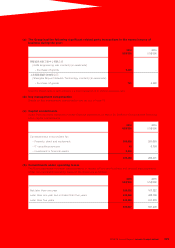
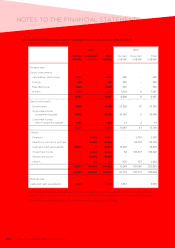
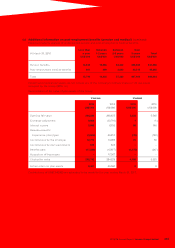
35 RETIREMENT BENEFIT OBLIGATIONS (continued)
(c) Additional information on post-employment benefits (pension and medical) (continued)
The amounts recognized in the consolidated income statement are as follows:
Pension Medical
2016
US$’000
2015
US$’000
2016
US$’000
2015
US$’000
Current service cost 16,822 14,272 604 455
Past service cost (1,928)(1,542)––
Interest cost 10,982 10,845 1,004 676
Interest income (5,995)(6,150)(85)(146)
Curtailment (gains)/losses (800)5,205 (34)(1,870)
Total expense recognized in the consolidated
income statement 19,081 22,630 1,489 (885)
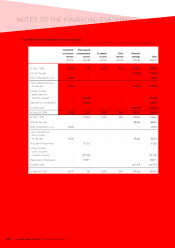
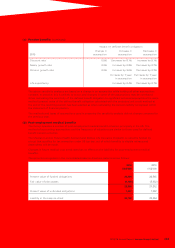
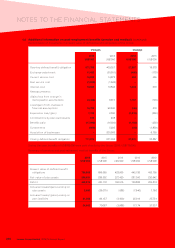
36 BUSINESS COMBINATIONS
The Group did not undertake any material business combinations in the current year.
In respect of prior year’s acquisitions, during the year the Group has finalized the fair value assessments for the
net assets acquired (including intangible assets) from the business combination activities in respect of Motorola
and System X. On completion of the fair value assessments, adjustments made to the provisional calculation of
identifiable assets and liabilities (as at March 31, 2015) amounted to US$296 million, with an equivalent increase in
the reported value of goodwill. The changes mainly represent finalization of future billing adjustments, deferred
tax adjustments, provisions and recovery of impaired trade receivables at the respective acquisition dates. The
comparative consolidated balance sheet as at March 31, 2015 has been retrospectively reclassified to reflect the
final allocation of fair values of the net assets acquired in FY2014/15.
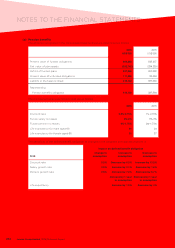
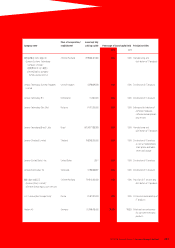
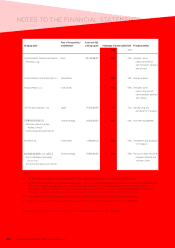
Details of net assets acquired and goodwill arising from the business combination activities at the acquisition dates
were as follows:
Motorola
US$’000
System X
US$’000
Total
US$’000
Total purchase consideration 3,095,940 2,136,150 5,232,090
Less: Fair value of net assets acquired, as finalized
– Cash and cash equivalents 404,157 17,801 421,958
– Property, plant and equipment 455,060 82,640 537,700
– Deferred tax assets less liabilities 43,925 (100,311) (56,386)
– Intangible assets 1,587,718 1,510,000 3,097,718
– Other non-current assets 20,906 –20,906
– Net working capital except cash and cash equivalents (1,015,115) (172,112) (1,187,227)
– Non-current liabilities (238,887) (382,976) (621,863)
Fair value of net assets acquired, as finalized 1,257,764 955,042 2,212,806
Goodwill (Note 17(a)) 1,838,176 1,181,108 3,019,284