Lenovo 2016 Annual Report Download - page 186
Download and view the complete annual report
Please find page 186 of the 2016 Lenovo annual report below. You can navigate through the pages in the report by either clicking on the pages listed below, or by using the keyword search tool below to find specific information within the annual report.-
 1
1 -
2
-
3
-
4
-
5
-
6
-
7
-
8
-
9
-
10
-
11
-
12
-
13
-
14
-
15
-
16
-
17
-
18
-
19
-
20
-
21
-
22
-
23
-
24
-
25
-
26
-
27
-
28
-
29
-
30
-
31
-
32
-
33
-
34
-
35
-
36
-
37
-
38
-
39
-
40
-
41
-
42
-
43
-
44
-
45
-
46
-
47
-
48
-
49
-
50
-
51
-
52
-
53
-
54
-
55
-
56
-
57
-
58
-
59
-
60
-
61
-
62
-
63
-
64
-
65
-
66
-
67
-
68
-
69
-
70
-
71
-
72
-
73
-
74
-
75
-
76
-
77
-
78
-
79
-
80
-
81
-
82
-
83
-
84
-
85
-
86
-
87
-
88
-
89
-
90
-
91
-
92
-
93
-
94
-
95
-
96
-
97
-
98
-
99
-
100
-
101
-
102
-
103
-
104
-
105
-
106
-
107
-
108
-
109
-
110
-
111
-
112
-
113
-
114
-
115
-
116
-
117
-
118
-
119
-
120
-
121
-
122
-
123
-
124
-
125
-
126
-
127
-
128
-
129
-
130
-
131
-
132
-
133
-
134
-
135
-
136
-
137
-
138
-
139
-
140
-
141
-
142
-
143
-
144
-
145
-
146
-
147
-
148
-
149
-
150
-
151
-
152
-
153
-
154
-
155
-
156
-
157
-
158
-
159
-
160
-
161
-
162
-
163
-
164
-
165
-
166
-
167
-
168
-
169
-
170
-
171
-
172
-
173
-
174
-
175
-
 176
176 -
 177
177 -
 178
178 -
 179
179 -
 180
180 -
 181
181 -
 182
182 -
 183
183 -
 184
184 -
 185
185 -
 186
186 -
 187
187 -
 188
188 -
 189
189 -
 190
190 -
 191
191 -
 192
192 -
 193
193 -
 194
194 -
 195
195 -
 196
196 -
197
-
198
-
199
-
200
-
201
-
202
-
203
-
204
-
205
-
206
-
207
-
208
-
209
-
210
-
211
-
212
-
213
-
214
-
215
-
216
-
217
-
218
-
219
-
220
-
221
-
222
-
223
-
224
-
225
-
226
-
227
-
228
-
229
-
230
-
231
-
232
-
233
-
234
-
235
-
236
-
237
-
238
-
239
-
240
-
241
-
242
-
243
-
244
-
245
-
246
-
247
 |
 |

184 Lenovo Group Limited 2015/16 Annual Report
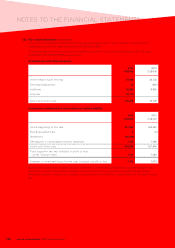
NOTES TO THE FINANCIAL STATEMENTS
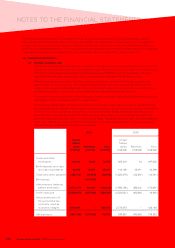
3 FINANCIAL RISK MANAGEMENT (continued)
(a) Financial risk factors (continued)
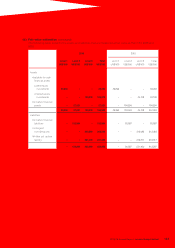
(iv) Liquidity risk (continued)
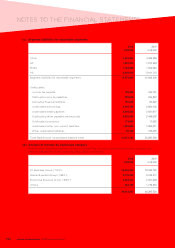
The tables below analyze the Group’s non-derivative financial liabilities and derivative financial liabilities
into relevant maturity groupings based on the remaining periods at the balance sheet date to the
contractual maturity dates. Derivative financial liabilities are included in the analysis if their contractual
maturities are essential for an understanding of the timing of the cash flows. The amounts disclosed in
the tables are the contractual undiscounted cash outflows/(inflows).
Repayable
on demand
or 3 months
or less
US$’000
Over
3 months
to 1 year
US$’000
Over 1 to
3 years
US$’000
Over 3 to
5 years
US$’000
Total
US$’000
At March 31, 2016
Borrowings 748,387 102,167 624,832 2,189,978 3,665,364
Trade, notes and other
payables and accruals 9,594,463 1,043,320 – – 10,637,783
Contingent considerations 260,590 – – – 260,590
Deferred considerations – – 1,447,890 –1,447,890
Guaranteed dividend to non-controlling
shareholders of a subsidiary –4,743 8,261 –13,004
Written put option liability – – 224,790 –224,790
Others – – 177,576 103,900 281,476
Derivatives settled in net:
Forward foreign exchange contracts 22,609 – – – 22,609
Derivatives settled in gross:
Forward foreign exchange contracts
– outflow 5,204,197 527,554 – – 5,731,751
– inflow (5,124,000) (513,602) – – (5,637,602)
At March 31, 2015
Borrowings 1,055,770 121,384 –1,900,000 3,077,154
Trade, notes and other
payables and accruals 10,297,382 3,899,707 – – 14,197,089
Contingent considerations –43,251 275,000 –318,251
Deferred considerations – – 1,502,172 –1,502,172
Guaranteed dividend to non-controlling
shareholders of a subsidiary –5,318 9,749 –15,067
Written put option liability – – 224,790 –224,790
Others – – 133,400 109,106 242,506
Derivatives settled in net:
Forward foreign exchange contracts 1,297 – – – 1,297
Derivatives settled in gross:
Forward foreign exchange contracts
– outflow 6,117,803 1,006,623 – – 7,124,426
– inflow (7,112,439) (1,024,005) – – (8,136,444)