Lenovo 2016 Annual Report Download - page 184
Download and view the complete annual report
Please find page 184 of the 2016 Lenovo annual report below. You can navigate through the pages in the report by either clicking on the pages listed below, or by using the keyword search tool below to find specific information within the annual report.-
 1
1 -
2
-
3
-
4
-
5
-
6
-
7
-
8
-
9
-
10
-
11
-
12
-
13
-
14
-
15
-
16
-
17
-
18
-
19
-
20
-
21
-
22
-
23
-
24
-
25
-
26
-
27
-
28
-
29
-
30
-
31
-
32
-
33
-
34
-
35
-
36
-
37
-
38
-
39
-
40
-
41
-
42
-
43
-
44
-
45
-
46
-
47
-
48
-
49
-
50
-
51
-
52
-
53
-
54
-
55
-
56
-
57
-
58
-
59
-
60
-
61
-
62
-
63
-
64
-
65
-
66
-
67
-
68
-
69
-
70
-
71
-
72
-
73
-
74
-
75
-
76
-
77
-
78
-
79
-
80
-
81
-
82
-
83
-
84
-
85
-
86
-
87
-
88
-
89
-
90
-
91
-
92
-
93
-
94
-
95
-
96
-
97
-
98
-
99
-
100
-
101
-
102
-
103
-
104
-
105
-
106
-
107
-
108
-
109
-
110
-
111
-
112
-
113
-
114
-
115
-
116
-
117
-
118
-
119
-
120
-
121
-
122
-
123
-
124
-
125
-
126
-
127
-
128
-
129
-
130
-
131
-
132
-
133
-
134
-
135
-
136
-
137
-
138
-
139
-
140
-
141
-
142
-
143
-
144
-
145
-
146
-
147
-
148
-
149
-
150
-
151
-
152
-
153
-
154
-
155
-
156
-
157
-
158
-
159
-
160
-
161
-
162
-
163
-
164
-
165
-
166
-
167
-
168
-
169
-
170
-
171
-
172
-
173
-
 174
174 -
 175
175 -
 176
176 -
 177
177 -
 178
178 -
 179
179 -
 180
180 -
 181
181 -
 182
182 -
 183
183 -
 184
184 -
 185
185 -
 186
186 -
 187
187 -
 188
188 -
 189
189 -
 190
190 -
 191
191 -
 192
192 -
 193
193 -
 194
194 -
195
-
196
-
197
-
198
-
199
-
200
-
201
-
202
-
203
-
204
-
205
-
206
-
207
-
208
-
209
-
210
-
211
-
212
-
213
-
214
-
215
-
216
-
217
-
218
-
219
-
220
-
221
-
222
-
223
-
224
-
225
-
226
-
227
-
228
-
229
-
230
-
231
-
232
-
233
-
234
-
235
-
236
-
237
-
238
-
239
-
240
-
241
-
242
-
243
-
244
-
245
-
246
-
247
 |
 |

182 Lenovo Group Limited 2015/16 Annual Report
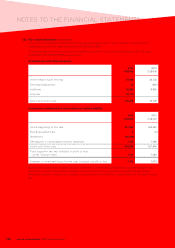
NOTES TO THE FINANCIAL STATEMENTS
3 FINANCIAL RISK MANAGEMENT
The Group’s activities expose it to a variety of financial risks, such as market risk (including foreign currency
risk and cash flow interest rate risk), credit risk, and liquidity risk. The Group’s overall financial risk management
program focuses on the unpredictability of financial markets and seeks to minimize potential adverse effects on
the Group’s financial performance. The Group uses derivative financial instruments to hedge certain risk exposures.
Financial risk management is carried out by the centralized treasury department (“Group Treasury”).
(a) Financial risk factors
(i) Foreign currency risk
The Group operates internationally and is exposed to foreign currency risk arising from various currency
exposures, primarily with respect to United States dollar, Renminbi and Euro. Foreign currency risk arises
from future commercial transactions, recognized assets and liabilities and net investment in foreign
operations denominated in a currency that is not the group companies’ functional currency.
Management has set up a policy to require group companies to manage their foreign currency risk
against their functional currency. The Group’s forward foreign currency contracts are either used to
hedge a percentage of anticipated cash flows (mainly export sales and purchase of inventories) which
are highly probable, or used as fair value hedges for the identified assets and liabilities.
For segment reporting purposes, external hedge contracts on assets, liabilities or future transactions are
designated to each operating segment, as appropriate.
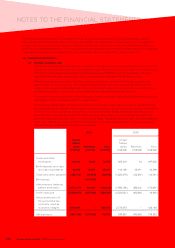
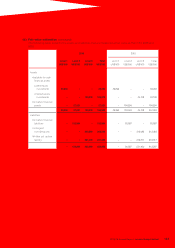
The following tables detail the Group’s exposure at the balance sheet date to currency risk arising from
recognized assets or liabilities denominated in a currency other than the functional currency of the entity
to which they relate, except for the currency risk between United States dollar and Hong Kong dollar
given the two currencies are under the linked exchange rate system. For presentation purposes, the
amounts of the exposure are shown in United States dollar, translated using the spot rate at the balance
sheet date. Differences resulting from the translation of the financial statements of foreign operations
into the Group’s presentation currency are excluded.
2016 2015
United
States
dollar
US$’000
Renminbi
US$’000
Euro
US$’000
United
States
dollar
US$’000
Renminbi
US$’000
Euro
US$’000
Trade and other
receivables 119,441 8,883 73,750 262,319 14 167,002
Bank deposits and cash
and cash equivalents 62,056 43,591 85,161 112,198 38,411 10,286
Trade and other payables (482,730) (14,556) (13,165)(1,224,378) (22,997) (14,541)
Borrowings – (616,855) – – – –
Intercompany balances
before elimination (1,911,174)331,844 (402,243)(1,683,160)388,212 (172,687)
Gross exposure (2,212,407) (247,093) (256,497)(2,533,021)403,640 (9,940)
Notional amounts of
forward exchange
contracts used as
economic hedges 1,910,648 –430,473 2,775,878 –128,162
Net exposure (301,759) (247,093)173,976 242,857 403,640 118,222