Lenovo 2016 Annual Report Download - page 36
Download and view the complete annual report
Please find page 36 of the 2016 Lenovo annual report below. You can navigate through the pages in the report by either clicking on the pages listed below, or by using the keyword search tool below to find specific information within the annual report.-
 1
1 -
2
-
3
-
4
-
5
-
6
-
7
-
8
-
9
-
10
-
11
-
12
-
13
-
14
-
15
-
16
-
17
-
18
-
19
-
20
-
21
-
22
-
23
-
24
-
25
-
 26
26 -
 27
27 -
 28
28 -
 29
29 -
 30
30 -
 31
31 -
 32
32 -
 33
33 -
 34
34 -
 35
35 -
 36
36 -
 37
37 -
 38
38 -
 39
39 -
 40
40 -
 41
41 -
 42
42 -
 43
43 -
 44
44 -
 45
45 -
 46
46 -
47
-
48
-
49
-
50
-
51
-
52
-
53
-
54
-
55
-
56
-
57
-
58
-
59
-
60
-
61
-
62
-
63
-
64
-
65
-
66
-
67
-
68
-
69
-
70
-
71
-
72
-
73
-
74
-
75
-
76
-
77
-
78
-
79
-
80
-
81
-
82
-
83
-
84
-
85
-
86
-
87
-
88
-
89
-
90
-
91
-
92
-
93
-
94
-
95
-
96
-
97
-
98
-
99
-
100
-
101
-
102
-
103
-
104
-
105
-
106
-
107
-
108
-
109
-
110
-
111
-
112
-
113
-
114
-
115
-
116
-
117
-
118
-
119
-
120
-
121
-
122
-
123
-
124
-
125
-
126
-
127
-
128
-
129
-
130
-
131
-
132
-
133
-
134
-
135
-
136
-
137
-
138
-
139
-
140
-
141
-
142
-
143
-
144
-
145
-
146
-
147
-
148
-
149
-
150
-
151
-
152
-
153
-
154
-
155
-
156
-
157
-
158
-
159
-
160
-
161
-
162
-
163
-
164
-
165
-
166
-
167
-
168
-
169
-
170
-
171
-
172
-
173
-
174
-
175
-
176
-
177
-
178
-
179
-
180
-
181
-
182
-
183
-
184
-
185
-
186
-
187
-
188
-
189
-
190
-
191
-
192
-
193
-
194
-
195
-
196
-
197
-
198
-
199
-
200
-
201
-
202
-
203
-
204
-
205
-
206
-
207
-
208
-
209
-
210
-
211
-
212
-
213
-
214
-
215
-
216
-
217
-
218
-
219
-
220
-
221
-
222
-
223
-
224
-
225
-
226
-
227
-
228
-
229
-
230
-
231
-
232
-
233
-
234
-
235
-
236
-
237
-
238
-
239
-
240
-
241
-
242
-
243
-
244
-
245
-
246
-
247
 |
 |

34 Lenovo Group Limited 2015/16 Annual Report
MANAGEMENT’S DISCUSSION & ANALYSIS
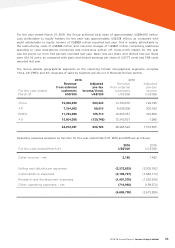
Operating expenses for the year increased by 20 percent as compared with last year. This is principally
attributable to the operating expenses of US$2,263 million recorded by System X and Motorola following
the completion of the respective acquisitions on October 1 and October 30, 2014 (2015: US$1,433 million);
and the restructuring and one-time charges in driving greater efficiency across organizations, primarily
associated with severance costs of US$212 million, loss on impairment and disposal of assets of US$310
million, provision for lease obligations of US$62 million; and smartphone inventories write off of US$173
million in relation to realignment of key elements under Mobile Business Group. Key expenses by nature
comprise:
For the year ended March 31
2016
US$’000
2015
US$’000
Depreciation of property, plant and equipment and
amortization of prepaid lease payments (166,116)(127,516)
Amortization of intangible assets (432,075)(287,877)
Employee benefit costs, including (3,302,749)(2,997,614)
– long-term incentive awards (161,097)(99,062)
– severance and related costs (212,475)–
Rental expenses under operating leases (80,527)(88,774)
Net foreign exchange loss (126,004)(189,550)
Advertising and promotional expenses (726,173)(675,760)
Inventories write off (173,424)–
Loss on impairment and disposal of assets (310,201)–
Others (1,368,489)(1,206,208)
(6,685,758)(5,573,299)
Depreciation and amortization charges increased by US$183 million which is attributable to the amounts
brought in by System X and Motorola. Additional amortization of intangible assets in connection with
the acquisition of System X and Motorola for the year totaled US$266 million (2015: US$127 million). The
increase in employee benefit costs is in line with the increased average headcount during the year as a
result of the two acquisitions, and severance and related costs incurred for restructuring actions during
the year. A charge for one-time smartphone inventories write off of US$173 million has been made by the
Group during the year. The impact of currency fluctuations during the year presented a challenge, the
Group recorded a net exchange loss of US$126 million (2015: US$190 million) for the year.
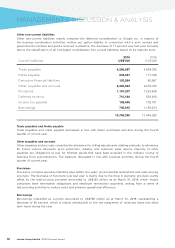
Other non-operating expenses (net) for the years ended March 31, 2016 and 2015 comprise:
For the year ended March 31
2016
US$’000
2015
US$’000
Finance income 32,816 30,902
Finance costs (236,751)(185,504)
Share of (losses)/profits of associates and joint ventures (11,095)17,055
(215,030)(137,547)