Lenovo 2016 Annual Report Download - page 24
Download and view the complete annual report
Please find page 24 of the 2016 Lenovo annual report below. You can navigate through the pages in the report by either clicking on the pages listed below, or by using the keyword search tool below to find specific information within the annual report.-
 1
1 -
2
-
3
-
4
-
5
-
6
-
7
-
8
-
9
-
10
-
11
-
12
-
13
-
 14
14 -
 15
15 -
 16
16 -
 17
17 -
 18
18 -
 19
19 -
 20
20 -
 21
21 -
 22
22 -
 23
23 -
 24
24 -
 25
25 -
 26
26 -
 27
27 -
 28
28 -
 29
29 -
 30
30 -
 31
31 -
 32
32 -
 33
33 -
 34
34 -
35
-
36
-
37
-
38
-
39
-
40
-
41
-
42
-
43
-
44
-
45
-
46
-
47
-
48
-
49
-
50
-
51
-
52
-
53
-
54
-
55
-
56
-
57
-
58
-
59
-
60
-
61
-
62
-
63
-
64
-
65
-
66
-
67
-
68
-
69
-
70
-
71
-
72
-
73
-
74
-
75
-
76
-
77
-
78
-
79
-
80
-
81
-
82
-
83
-
84
-
85
-
86
-
87
-
88
-
89
-
90
-
91
-
92
-
93
-
94
-
95
-
96
-
97
-
98
-
99
-
100
-
101
-
102
-
103
-
104
-
105
-
106
-
107
-
108
-
109
-
110
-
111
-
112
-
113
-
114
-
115
-
116
-
117
-
118
-
119
-
120
-
121
-
122
-
123
-
124
-
125
-
126
-
127
-
128
-
129
-
130
-
131
-
132
-
133
-
134
-
135
-
136
-
137
-
138
-
139
-
140
-
141
-
142
-
143
-
144
-
145
-
146
-
147
-
148
-
149
-
150
-
151
-
152
-
153
-
154
-
155
-
156
-
157
-
158
-
159
-
160
-
161
-
162
-
163
-
164
-
165
-
166
-
167
-
168
-
169
-
170
-
171
-
172
-
173
-
174
-
175
-
176
-
177
-
178
-
179
-
180
-
181
-
182
-
183
-
184
-
185
-
186
-
187
-
188
-
189
-
190
-
191
-
192
-
193
-
194
-
195
-
196
-
197
-
198
-
199
-
200
-
201
-
202
-
203
-
204
-
205
-
206
-
207
-
208
-
209
-
210
-
211
-
212
-
213
-
214
-
215
-
216
-
217
-
218
-
219
-
220
-
221
-
222
-
223
-
224
-
225
-
226
-
227
-
228
-
229
-
230
-
231
-
232
-
233
-
234
-
235
-
236
-
237
-
238
-
239
-
240
-
241
-
242
-
243
-
244
-
245
-
246
-
247
 |
 |

22 Lenovo Group Limited 2015/16 Annual Report
MANAGEMENT’S DISCUSSION & ANALYSIS
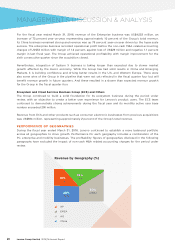
Europe-Middle East-Africa (EMEA)
EMEA accounted for 26 percent of the Group’s total revenue. Lenovo’s PC unit shipments in EMEA
declined by 17 percent year-on-year, against a market decline of 20 percent year-on-year, impacted by
macro-economic issues and currency fluctuations which resulted in a much softer PC market in EMEA.
The Group’s market share increased by 0.6 percentage points year-on-year to a record 20.0 percent in
EMEA, according to preliminary industry estimates.
The Group continued to expand its smartphone business in EMEA and achieved strong growth of 83
percent during the fiscal year under review, with particularly strong performance in Eastern Europe and
MEA. The Group continued its efforts to enhance its competitiveness and further stabilize its enterprise
business performance during the quarter under review.
Profit before taxation in EMEA was US$126 million during the fiscal year under review against US$411
million last year, with pre-tax margin declining by 2.1 percentage points year-on-year to 1.1 percent,
affected by the decline in PC shipments due to the slow market and the impact of currency fluctuations.
BUSINESS REALIGNMENT PLAN UPDATE
The Group announced a plan to execute a series of business realignment actions in fiscal quarter two to
enable the Group to focus resources, sharpen its business model and efficiently capitalize on the most
attractive market opportunities in mobile, PC and enterprise. Executions of these actions by the Group
have been on track and as a result a total savings of approximately US$690 million were realized by the
Group in second half of the fiscal year. The Group is on track to deliver its year run rate savings of US$1.35
billion.
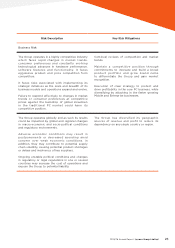
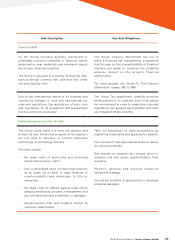
MATERIAL RISKS OF THE GROUP
The following are key risks that the Group considers to be of great significance to the Group as it stands
today. They have the potential to affect the Group’s business adversely and materially.
For each risk there is a description of the possible impact of the risk on the Group should it occur, and the
mitigation plan to manage the risk.
The Group also faces risks and uncertainties in common with other businesses. These have not been set
out as key risks below.
This list is likely to change over time as different risks take on larger or smaller significance. The size,
complexity and spread of the business and the continually changing environment in which the Group
operates also mean that the list cannot be an exhaustive list of all significant risks that could affect the
Group.