Lenovo 2016 Annual Report Download - page 35
Download and view the complete annual report
Please find page 35 of the 2016 Lenovo annual report below. You can navigate through the pages in the report by either clicking on the pages listed below, or by using the keyword search tool below to find specific information within the annual report.-
 1
1 -
2
-
3
-
4
-
5
-
6
-
7
-
8
-
9
-
10
-
11
-
12
-
13
-
14
-
15
-
16
-
17
-
18
-
19
-
20
-
21
-
22
-
23
-
24
-
 25
25 -
 26
26 -
 27
27 -
 28
28 -
 29
29 -
 30
30 -
 31
31 -
 32
32 -
 33
33 -
 34
34 -
 35
35 -
 36
36 -
 37
37 -
 38
38 -
 39
39 -
 40
40 -
 41
41 -
 42
42 -
 43
43 -
 44
44 -
 45
45 -
46
-
47
-
48
-
49
-
50
-
51
-
52
-
53
-
54
-
55
-
56
-
57
-
58
-
59
-
60
-
61
-
62
-
63
-
64
-
65
-
66
-
67
-
68
-
69
-
70
-
71
-
72
-
73
-
74
-
75
-
76
-
77
-
78
-
79
-
80
-
81
-
82
-
83
-
84
-
85
-
86
-
87
-
88
-
89
-
90
-
91
-
92
-
93
-
94
-
95
-
96
-
97
-
98
-
99
-
100
-
101
-
102
-
103
-
104
-
105
-
106
-
107
-
108
-
109
-
110
-
111
-
112
-
113
-
114
-
115
-
116
-
117
-
118
-
119
-
120
-
121
-
122
-
123
-
124
-
125
-
126
-
127
-
128
-
129
-
130
-
131
-
132
-
133
-
134
-
135
-
136
-
137
-
138
-
139
-
140
-
141
-
142
-
143
-
144
-
145
-
146
-
147
-
148
-
149
-
150
-
151
-
152
-
153
-
154
-
155
-
156
-
157
-
158
-
159
-
160
-
161
-
162
-
163
-
164
-
165
-
166
-
167
-
168
-
169
-
170
-
171
-
172
-
173
-
174
-
175
-
176
-
177
-
178
-
179
-
180
-
181
-
182
-
183
-
184
-
185
-
186
-
187
-
188
-
189
-
190
-
191
-
192
-
193
-
194
-
195
-
196
-
197
-
198
-
199
-
200
-
201
-
202
-
203
-
204
-
205
-
206
-
207
-
208
-
209
-
210
-
211
-
212
-
213
-
214
-
215
-
216
-
217
-
218
-
219
-
220
-
221
-
222
-
223
-
224
-
225
-
226
-
227
-
228
-
229
-
230
-
231
-
232
-
233
-
234
-
235
-
236
-
237
-
238
-
239
-
240
-
241
-
242
-
243
-
244
-
245
-
246
-
247
 |
 |

33
2015/16 Annual Report Lenovo Group Limited
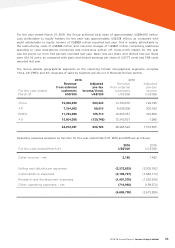
For the year ended March 31, 2016, the Group achieved total sales of approximately US$44,912 million.
Loss attributable to equity holders for the year was approximately US$128 million, as compared with
profit attributable to equity holders of US$829 million reported last year. This is mainly attributable to
the restructuring costs of US$596 million; and one-time charges of US$327 million comprising additional
spending to clear smartphone inventories and inventories written off. Gross profit margin for the year
was 0.4 points up from 14.4 percent reported last year. Basic loss per share and diluted loss per share
were US1.16 cents, as compared with basic and diluted earnings per share of US7.77 cents and 7.69 cents
reported last year.
The Group adopts geographical segments as the reporting format. Geographical segments comprise
China, AP, EMEA and AG. Analyses of sales by segment are set out in Business Review section.
2016 2015
For the year ended
March 31
Revenue
from external
customers
Adjusted
pre-tax
income/(loss)
Revenue
from external
customers
Adjusted
pre-tax
income
US$’000 US$’000 US$’000 US$’000
China 12,358,639 563,245 14,700,270 794,795
AP 7,154,662 88,516 6,549,339 302,183
EMEA 11,794,698 125,710 12,803,357 410,858
AG 13,604,098 (120,748)12,242,627 7,999
44,912,097 656,723 46,295,593 1,515,835
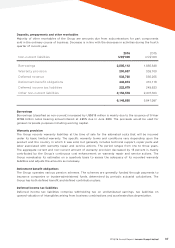
Operating expenses analyzed by function for the year ended March 31, 2016 and 2015 are as follows:
For the year ended March 31
2016
US$’000
2015
US$’000
Other income – net 2,185 1,490
Selling and distribution expenses (2,372,833)(2,302,182)
Administrative expenses (2,108,747)(1,883,114)
Research and development expenses (1,491,370)(1,220,919)
Other operating expenses – net (714,993)(168,574)
(6,685,758)(5,573,299)