Lenovo 2016 Annual Report Download - page 187
Download and view the complete annual report
Please find page 187 of the 2016 Lenovo annual report below. You can navigate through the pages in the report by either clicking on the pages listed below, or by using the keyword search tool below to find specific information within the annual report.-
 1
1 -
2
-
3
-
4
-
5
-
6
-
7
-
8
-
9
-
10
-
11
-
12
-
13
-
14
-
15
-
16
-
17
-
18
-
19
-
20
-
21
-
22
-
23
-
24
-
25
-
26
-
27
-
28
-
29
-
30
-
31
-
32
-
33
-
34
-
35
-
36
-
37
-
38
-
39
-
40
-
41
-
42
-
43
-
44
-
45
-
46
-
47
-
48
-
49
-
50
-
51
-
52
-
53
-
54
-
55
-
56
-
57
-
58
-
59
-
60
-
61
-
62
-
63
-
64
-
65
-
66
-
67
-
68
-
69
-
70
-
71
-
72
-
73
-
74
-
75
-
76
-
77
-
78
-
79
-
80
-
81
-
82
-
83
-
84
-
85
-
86
-
87
-
88
-
89
-
90
-
91
-
92
-
93
-
94
-
95
-
96
-
97
-
98
-
99
-
100
-
101
-
102
-
103
-
104
-
105
-
106
-
107
-
108
-
109
-
110
-
111
-
112
-
113
-
114
-
115
-
116
-
117
-
118
-
119
-
120
-
121
-
122
-
123
-
124
-
125
-
126
-
127
-
128
-
129
-
130
-
131
-
132
-
133
-
134
-
135
-
136
-
137
-
138
-
139
-
140
-
141
-
142
-
143
-
144
-
145
-
146
-
147
-
148
-
149
-
150
-
151
-
152
-
153
-
154
-
155
-
156
-
157
-
158
-
159
-
160
-
161
-
162
-
163
-
164
-
165
-
166
-
167
-
168
-
169
-
170
-
171
-
172
-
173
-
174
-
175
-
176
-
 177
177 -
 178
178 -
 179
179 -
 180
180 -
 181
181 -
 182
182 -
 183
183 -
 184
184 -
 185
185 -
 186
186 -
 187
187 -
 188
188 -
 189
189 -
 190
190 -
 191
191 -
 192
192 -
 193
193 -
 194
194 -
 195
195 -
 196
196 -
 197
197 -
198
-
199
-
200
-
201
-
202
-
203
-
204
-
205
-
206
-
207
-
208
-
209
-
210
-
211
-
212
-
213
-
214
-
215
-
216
-
217
-
218
-
219
-
220
-
221
-
222
-
223
-
224
-
225
-
226
-
227
-
228
-
229
-
230
-
231
-
232
-
233
-
234
-
235
-
236
-
237
-
238
-
239
-
240
-
241
-
242
-
243
-
244
-
245
-
246
-
247
 |
 |

185
2015/16 Annual Report Lenovo Group Limited
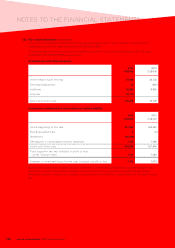
3 FINANCIAL RISK MANAGEMENT (continued)
(b) Market risks sensitivity analysis
HKFRS 7 “Financial instruments: Disclosures” requires the disclosure of a sensitivity analysis for market risks
that show the effects of a hypothetical change in the relevant market risk variable to which the Group is
exposed to at the balance sheet date on profit or loss and total equity.
The sensitivity analysis for each type of market risks does not reflect inter-dependencies between risk
variables. The sensitivity analysis assumes that a hypothetical change of the relevant risk variable had
occurred at the balance sheet date and had been applied to the relevant risk variable in existence on that
date. The bases and assumptions adopted in the preparation of the analyses will by definition, seldom equal
to the related actual results.
The disclosure of the sensitivity analysis on market risks is solely for compliance with HKFRS 7 disclosure
requirements in respect of financial instruments, and are for illustration purposes only; and it should be noted
that the hypothetical amounts so generated do not represent a projection of likely future events and profits
or losses of the Group.
(i) Foreign currency exchange rate sensitivity analysis
At March 31, 2016, if United States dollar had weakened/strengthened by one percent against the major
currencies with all other variables held constant, post-tax loss for the year would have been US$2.2
million lower/higher (2015: post-tax profit for the year would have been US$2.7 million higher/lower),
mainly as a result of foreign exchange gains/losses on translation of unhedged portion of receivable and
payable balances.
The analysis above is based on the assumption that United States dollar weakened or strengthened
against all other currencies in the same direction and magnitude, but it may not be necessarily true in
reality.
(ii) Interest rate sensitivity analysis
At March 31, 2016, if interest rate on borrowings had been 25 basis points higher/lower with all other
variables held constant, post-tax loss for the year would have been US$3.2 million higher/lower (2015:
post tax profit for the year would have been US$1.5 million lower/higher).
At March 31, 2016, if interest rates on customer financing programs had been 25 basis points higher/
lower with all other variables held constant, post-tax loss for the year would have been US$3.7 million
higher/lower (2015: post tax profit for the year would have been US$2.8 million lower/higher). This
analysis is based on the assumption that the interest rates of all the currencies covered by the customer
financing programs go up and down at the same time and with the same magnitude; however, such
assumptions may not be necessarily true in reality.