Kraft 2003 Annual Report Download - page 61
Download and view the complete annual report
Please find page 61 of the 2003 Kraft annual report below. You can navigate through the pages in the report by either clicking on the pages listed below, or by using the keyword search tool below to find specific information within the annual report.-
 1
1 -
2
-
3
-
4
-
5
-
6
-
7
-
8
-
9
-
10
-
11
-
12
-
13
-
14
-
15
-
16
-
17
-
18
-
19
-
20
-
21
-
22
-
23
-
24
-
25
-
26
-
27
-
28
-
29
-
30
-
31
-
32
-
33
-
34
-
35
-
36
-
37
-
38
-
39
-
40
-
41
-
42
-
43
-
44
-
45
-
46
-
47
-
48
-
49
-
50
-
 51
51 -
 52
52 -
 53
53 -
 54
54 -
 55
55 -
 56
56 -
 57
57 -
 58
58 -
 59
59 -
 60
60 -
 61
61 -
 62
62 -
 63
63 -
 64
64 -
 65
65 -
 66
66
 |
 |

59
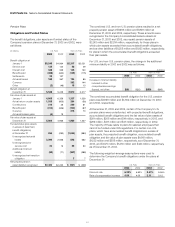
During 2003 and 2002, the Company recorded the following pre-tax
charges or (gains):
(in millions) 2003 Quarters
First Second Third Fourth
Asset impairment and
exit costs $6
Integration costs $(13)
Gains on sales
of businesses (23) (8)
$
—
$
—
$(17)$(21
(in millions) 2002 Quarters
First Second Third Fourth
Asset impairment and
exit costs $142
Integration costs and a
loss on sale of a
food factory 27 $92 $ (8)
Gains on sales
of businesses (3) (77)
$169 $89 $
—
$(85)
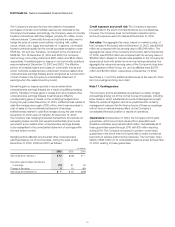
Note 18. Subsequent Event:
In January 2004, the Company announced a three-year restructuring
program with the objective to leverage the Company’s global scale,
realign and lower the cost structure and optimize capacity utilization.
As part of this program, the Company anticipates the exit or closing
of up to 20 plants and the elimination of approximately six thousand
positions. Over the next three years, the Company expects to incur
up to $1.2 billion in pre-tax charges, reflecting asset disposals,
severance and other implementation costs, including an estimated
range of $750 million to $800 million
in 2004. Approximately one-half of the pre-tax charges are
expected to require cash payments.
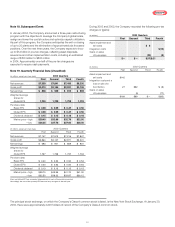
Note 19. Quarterly Financial Data (Unaudited):
(in millions, except per share data) 2003 Quarters
First Second Third Fourth
Net revenues $7,359 $7,841 $7,480 $8,330
Gross profit $3,010 $3,146 $2,921 $3,105
Net earnings $848 $ 949 $ 810 $ 869
Weighted average
shares for
diluted EPS 1,730 1,728 1,728 1,723
Per share data:
Basic EPS $0.49 $ 0.55 $ 0.47 $ 0.50
Diluted EPS $0.49 $ 0.55 $ 0.47 $ 0.50
Dividends declared $0.15 $ 0.15 $ 0.18 $ 0.18
Market price—high $39.40 $33.96 $32.79 $32.50
—low $26.35 $27.76 $27.60 $28.50
(in millions, except per share data) 2002 Quarters
First Second Third Fourth
Net revenues $7,147 $7,513 $7,216 $7,847
Gross profit $2,864 $3,127 $2,971 $3,041
Net earnings $693 $ 901 $ 869 $ 931
Weighted average
shares for
diluted EPS 1,737 1,738 1,737 1,734
Per share data:
Basic EPS $0.40 $ 0.52 $ 0.50 $ 0.54
Diluted EPS $0.40 $ 0.52 $ 0.50 $ 0.54
Dividends declared $0.13 $ 0.13 $ 0.15 $ 0.15
Market price—high $39.70 $43.95 $41.70 $41.30
—low $32.50 $38.32 $33.87 $36.12
Basic and diluted EPS are computed independently for each of the periods presented.
Accordingly, the sum of the quarterly EPS amounts may not agree to the total year.
The principal stock exchange, on which the Company’s Class A common stock is listed, is the New York Stock Exchange. At January 30,
2004, there were approximately 2,400 holders of record of the Company’s Class A common stock.