Kraft 2003 Annual Report Download - page 44
Download and view the complete annual report
Please find page 44 of the 2003 Kraft annual report below. You can navigate through the pages in the report by either clicking on the pages listed below, or by using the keyword search tool below to find specific information within the annual report.-
 1
1 -
2
-
3
-
4
-
5
-
6
-
7
-
8
-
9
-
10
-
11
-
12
-
13
-
14
-
15
-
16
-
17
-
18
-
19
-
20
-
21
-
22
-
23
-
24
-
25
-
26
-
27
-
28
-
29
-
30
-
31
-
32
-
33
-
 34
34 -
 35
35 -
 36
36 -
 37
37 -
 38
38 -
 39
39 -
 40
40 -
 41
41 -
 42
42 -
 43
43 -
 44
44 -
 45
45 -
 46
46 -
 47
47 -
 48
48 -
 49
49 -
 50
50 -
 51
51 -
 52
52 -
 53
53 -
 54
54 -
55
-
56
-
57
-
58
-
59
-
60
-
61
-
62
-
63
-
64
-
65
-
66
 |
 |

42
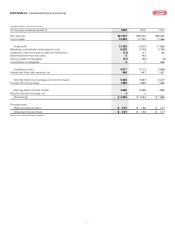
Kraft Foods Inc. Consolidated Statements of Cash Flows
(in millions of dollars)
For the years ended December 31, 2003 2002 2001
Cash Provided By (Used In) Operating Activities
Net earnings $3,476 $3,394 $ 1,882
Adjustments to reconcile net earnings to operating cash flows:
Depreciation and amortization 813 716 1,642
Deferred income tax provision 244 278 414
Gains on sales of businesses (31) (80) (8)
Integration costs and a loss on sale of a food factory, net of cash paid (26) 91 79
Asset impairment and exit costs, net of cash paid 6128
Cash effects of changes, net of the effects from acquired and
divested companies:
Receivables, net (45) 116 23
Inventories 197 (220) (107)
Accounts payable (116) (116) (73)
Income taxes (125) 277 74
Amounts due to Altria Group, Inc. and affiliates 169 (244) 138
Other working capital items (167) (330) (290)
Change in pension assets and postretirement liabilities, net (419) (217) (305)
Other 143 (73) (141)
Net cash provided by operating activities 4,119 3,720 3,328
Cash Provided By (Used In) Investing Activities
Capital expenditures (1,085) (1,184) (1,101)
Purchases of businesses, net of acquired cash (98) (122) (194)
Proceeds from sales of businesses 96 219 21
Other 38 35 52
Net cash used in investing activities (1,049) (1,052) (1,222)
Cash Provided By (Used In) Financing Activities
Net issuance (repayment) of short-term borrowings 819 (1,036) 2,505
Long-term debt proceeds 1,577 3,325 4,077
Long-term debt repaid (491) (609) (705)
Repayment of notes payable to Altria Group, Inc. and affiliates (2,757) (3,850) (16,350)
(Decrease) increase in amounts due to Altria Group, Inc. and affiliates (525) 660 142
Repurchase of Class A common stock (372) (170)
Dividends paid (1,089) (936) (225)
Net proceeds from sale of Class A common stock 8,425
Other 52
Net cash used in financing activities (2,786) (2,616) (2,131)
Effect of exchange rate changes on cash and cash equivalents 15 1(4)
Cash and cash equivalents:
Increase (decrease) 299 53 (29)
Balance at beginning of year 215 162 191
Balance at end of year $514 $215 $ 162
Cash paid:
Interest $642 $825 $ 1,433
Income taxes $1,726 $1,368 $ 1,058
See notes to consolidated financial statements.