Kraft 2003 Annual Report Download - page 4
Download and view the complete annual report
Please find page 4 of the 2003 Kraft annual report below. You can navigate through the pages in the report by either clicking on the pages listed below, or by using the keyword search tool below to find specific information within the annual report.-
 1
1 -
 2
2 -
 3
3 -
 4
4 -
 5
5 -
 6
6 -
 7
7 -
 8
8 -
 9
9 -
 10
10 -
 11
11 -
 12
12 -
 13
13 -
 14
14 -
 15
15 -
16
-
17
-
18
-
19
-
20
-
21
-
22
-
23
-
24
-
25
-
26
-
27
-
28
-
29
-
30
-
31
-
32
-
33
-
34
-
35
-
36
-
37
-
38
-
39
-
40
-
41
-
42
-
43
-
44
-
45
-
46
-
47
-
48
-
49
-
50
-
51
-
52
-
53
-
54
-
55
-
56
-
57
-
58
-
59
-
60
-
61
-
62
-
63
-
64
-
65
-
66
 |
 |

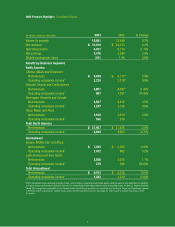
2003FinancialHighlights.ConsolidatedResults
2
(inmillions,exceptpersharedata) 2003 2002 %Change
Volume(inpounds) 18,681 18,549 0.7%
Netrevenues$ 31,010$ 29,723 4.3%
Operatingincome 6,011 6,114 (1.7)%
Netearnings 3,476 3,394 2.4%
Dilutedearningspershare 2.01 1.96 2.6%
ResultsbyBusinessSegment
NorthAmerica
Cheese,MealsandEnhancers
Netrevenues$ 9,439$ 9,172** 2.9%
Operatingcompaniesincome* 2,230 2,210** 0.9%
Biscuits,SnacksandConfectionery
Netrevenues 4,801 4,887** (1.8)%
Operatingcompaniesincome* 887 1,051** (15.6)%
Beverages,DessertsandCereals
Netrevenues 4,567 4,412 3.5%
Operatingcompaniesincome* 1,247 1,136 9.8%
OscarMayerandPizza
Netrevenues 3,100 3,014 2.9%
Operatingcompaniesincome* 556 556 –
TotalNorthAmerica
Netrevenues$ 21,907$ 21,485 2.0%
Operatingcompaniesincome* 4,920 4,953 (0.7)%
International
Europe,MiddleEastandAfrica
Netrevenues$ 7,045$ 6,203 13.6%
Operatingcompaniesincome* 1,012 962 5.2%
LatinAmericaandAsiaPacific
Netrevenues 2,058 2,035 1.1%
Operatingcompaniesincome* 270 368 (26.6)%
TotalInternational
Netrevenues$ 9,103$ 8,238 10.5%
Operatingcompaniesincome* 1,282 1,330 (3.6)%
*Kraft’smanagementreviewsoperatingcompaniesincome,whichisdefinedasoperatingincomebeforegeneralcorporateexpensesandamortizationofintangibles,
toevaluatesegmentperformanceandallocateresources.Forareconciliationofoperatingcompaniesincometooperatingincome,seeNote13.SegmentReporting.
**During2003,managementresponsibilityfortheCanadianBiscuitsandPetSnacksoperationswastransferredfromtheBiscuits,SnacksandConfectionerysegment
totheCheese,MealsandEnhancerssegment,whichcontainstheotherCanadianbusinesses.Accordingly,the2002amountshavebeenreclassifiedtoreflect
thetransfer.