Kraft 2003 Annual Report Download - page 56
Download and view the complete annual report
Please find page 56 of the 2003 Kraft annual report below. You can navigate through the pages in the report by either clicking on the pages listed below, or by using the keyword search tool below to find specific information within the annual report.-
 1
1 -
2
-
3
-
4
-
5
-
6
-
7
-
8
-
9
-
10
-
11
-
12
-
13
-
14
-
15
-
16
-
17
-
18
-
19
-
20
-
21
-
22
-
23
-
24
-
25
-
26
-
27
-
28
-
29
-
30
-
31
-
32
-
33
-
34
-
35
-
36
-
37
-
38
-
39
-
40
-
41
-
42
-
43
-
44
-
45
-
 46
46 -
 47
47 -
 48
48 -
 49
49 -
 50
50 -
 51
51 -
 52
52 -
 53
53 -
 54
54 -
 55
55 -
 56
56 -
 57
57 -
 58
58 -
 59
59 -
 60
60 -
 61
61 -
 62
62 -
 63
63 -
 64
64 -
 65
65 -
 66
66
 |
 |

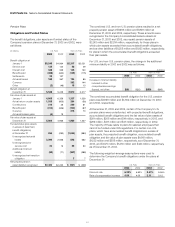
54
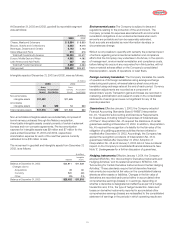
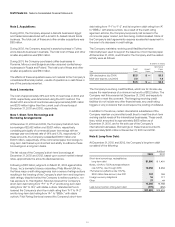
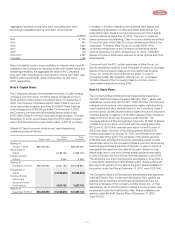
Kraft Foods Inc. Notes to Consolidated Financial Statements
Pension Plans
Obligations and Funded Status
The benefit obligations, plan assets and funded status of the
Company’s pension plans at December 31, 2003 and 2002, were
as follows:
(in millions) U.S. Plans Non-U.S. Plans
2003 2002 2003 2002
Benefit obligation at
January 1 $5,245 $4,964 $2,317 $2,021
Service cost 135 120 58 49
Interest cost 338 339 136 120
Benefits paid (398) (624) (132) (115)
Settlements 29 127
Actuarial losses 199 367 124 85
Currency 392 144
Other (2) (48) 15 13
Benefit obligation at
December 31 5,546 5,245 2,910 2,317
Fair value of plan assets at
January 1 4,965 6,359 1,337 1,329
Actual return on plan assets 1,038 (803) 204 (56)
Contributions 219 26 209 81
Benefits paid (414) (636) (100) (87)
Currency 216 70
Actuarial (losses) gains (6) 19
Fair value of plan assets at
December 31 5,802 4,965 1,866 1,337
Funded status (plan assets
in excess of (less than)
benefit obligations)
at December 31 256 (280) (1,044) (980)
Unrecognized actuarial
losses 2,292 2,558 848 682
Unrecognized prior
service cost 23 13 55 50
Additional minimum
liability (85) (71) (367) (288)
Unrecognized net transition
obligation 77
Net prepaid pension
asset (liability) recognized $2,486 $2,220 $(501) $(529)
The combined U.S. and non-U.S. pension plans resulted in a net
prepaid pension asset of $1,985 million and $1,691 million at
December 31, 2003 and 2002, respectively. These amounts were
recognized in the Company’s consolidated balance sheets at
December 31, 2003 and 2002, as prepaid pension assets of
$3,243 million and $2,814 million, respectively, for those plans in
which plan assets exceeded their accumulated benefit obligations,
and as other liabilities of $1,258 million and $1,123 million, respectively,
for plans in which the accumulated benefit obligations exceeded
their plan assets.
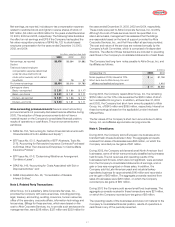
For U.S. and non-U.S. pension plans, the change in the additional
minimum liability in 2003 and 2002 was as follows:
(in millions)
U.S. Plans Non-U.S. Plans
2003 2002 2003 2002
Increase in minimum liability
included in other
comprehensive earnings
(losses), net of tax $(9) $(22) $(59) $(95)
The combined accumulated benefit obligation for the U.S. pension
plans was $4,898 million and $4,562 million at December 31, 2003
and 2002, respectively.
At December 31, 2003 and 2002, certain of the Company’s U.S.
pension plans were underfunded, with projected benefit obligations,
accumulated benefit obligations and the fair value of plan assets of
$261 million, $208 million and $14 million, respectively, in 2003, and
$269 million, $217 million and $45 million, respectively, in 2002.
The majority of these relate to plans for salaried employees that
cannot be funded under IRS regulations. For certain non-U.S.
plans, which have accumulated benefit obligations in excess of
plan assets, the projected benefit obligation, accumulated benefit
obligation and fair value of plan assets were $1,648 million,
$1,532 million and $588 million, respectively, as of December 31,
2003, and $1,375 million, $1,250 million and $424 million, respectively,
as of December 31, 2002.
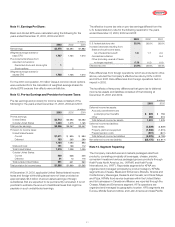
The following weighted-average assumptions were used to
determine the Company’s benefit obligations under the plans at
December 31:
U.S. Plans Non-U.S. Plans
2003 2002 2003 2002
Discount rate 6.25% 6.50% 5.41% 5.56%
Rate of compensation increase 4.00 4.00 3.11 3.12