Kraft 2003 Annual Report Download - page 33
Download and view the complete annual report
Please find page 33 of the 2003 Kraft annual report below. You can navigate through the pages in the report by either clicking on the pages listed below, or by using the keyword search tool below to find specific information within the annual report.-
 1
1 -
2
-
3
-
4
-
5
-
6
-
7
-
8
-
9
-
10
-
11
-
12
-
13
-
14
-
15
-
16
-
17
-
18
-
19
-
20
-
21
-
22
-
 23
23 -
 24
24 -
 25
25 -
 26
26 -
 27
27 -
 28
28 -
 29
29 -
 30
30 -
 31
31 -
 32
32 -
 33
33 -
 34
34 -
 35
35 -
 36
36 -
 37
37 -
 38
38 -
 39
39 -
 40
40 -
 41
41 -
 42
42 -
 43
43 -
44
-
45
-
46
-
47
-
48
-
49
-
50
-
51
-
52
-
53
-
54
-
55
-
56
-
57
-
58
-
59
-
60
-
61
-
62
-
63
-
64
-
65
-
66
 |
 |

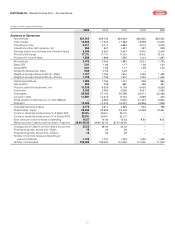
Operating companies income increased $157 million (3.3%), due
primarily to higher volume/mix ($174 million), favorable margins
($176 million, driven by lower commodity-related costs and
productivity) and Nabisco synergy savings, partially offset by
higher benefit expense, including the 2002 charge for asset
impairment and exit costs ($135 million).
The following discusses operating results within each of KFNA’s
reportable segments.
Cheese, Meals and Enhancers: Volume increased 12.5%, due
primarily to the inclusion in 2002 of a business that was previously
held for sale and volume gains in enhancers, meals and food
service, partially offset by a decline in cheese. Volume gains in
enhancers and meals were led by Kraft pourable dressings,
barbecue sauce, macaroni & cheese dinners and the 2001
acquisition of It’s Pasta Anytime. In cheese, volume declined as
lower dairy costs resulted in aggressive competitive activity by
private label manufacturers as they reduced prices and increased
merchandising levels.
Net revenues increased $158 million (1.8%), due primarily to the
inclusion in 2002 of a business that was previously held for sale
($252 million) and higher volume/mix ($34 million), partially offset
by lower net pricing ($118 million, primarily related to lower dairy
commodity costs).
Operating companies income increased $78 million (3.7%), due
primarily to favorable margins ($63 million, due primarily to lower
cheese commodity costs and productivity savings), lower integration
related costs in 2002 ($33 million), higher volume/mix ($31 million)
and the inclusion in 2002 of a business that was previously held
for sale ($23 million), partially offset by higher benefit expenses,
including the 2002 charge for asset impairment and exit costs
($60 million).
Biscuits, Snacks and Confectionery: Volume increased 0.9%,
as volume gains in biscuits and snacks were partially offset by a
decline in confectionery shipments. In biscuits, volume increased,
driven by new product initiatives in both cookies and crackers.
In snacks, volume also increased, due primarily to promotional
initiatives. Confectionery volume declined, resulting primarily from
competitive activity in the breath-freshening category, partially
offset by new product introductions in the non-chocolate
confectionery business.
Net revenues increased $98 million (2.0%), due primarily to higher
volume/mix ($61 million) and higher net pricing ($35 million).
Operating companies income increased $118 million (12.6%), due
primarily to favorable margins ($81 million, due primarily to higher
net pricing and lower commodity costs for nuts), Nabisco synergy
savings and higher volume/mix.
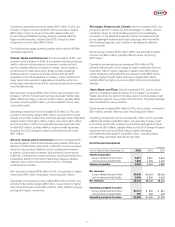
Beverages, Desserts and Cereals: Volume increased 8.4%, due
primarily to growth in ready-to-drink beverages. In coffee, volume
increased, driven by merchandising programs and packaging
innovation. In the desserts business, volume increases were led
by dry packaged desserts and frozen toppings, which benefited
from holiday programs, and in ready-to-eat desserts, aided by
new products.
Net revenues increased $175 million (4.1%), due primarily to higher
volume/mix ($245 million), partially offset by lower net pricing
($58 million).
Operating companies income decreased $56 million (4.7%),
primarily reflecting the 2002 charge for asset impairment and exit
costs ($47 million), higher integration-related costs ($44 million),
higher marketing, administration and research costs ($36 million,
including higher benefit costs) and lower margins ($18 million),
partially offset by higher volume/mix ($98 million) and productivity
savings.
Oscar Mayer and Pizza: Volume increased 2.3%, due to volume
gains in processed meats and pizza. The increase in processed
meats was driven by gains in hot dogs, bacon and soy-based meat
alternatives, aided by new product introductions. The pizza business
also benefited from new products.
Net revenues increased $84 million (2.9%), due to higher volume/mix
($97 million), partially offset by lower net pricing ($13 million).
Operating companies income increased $17 million (3.2%), primarily
reflecting favorable costs ($50 million, due primarily to lower meat
and cheese commodity costs and productivity savings) and higher
volume/mix ($30 million), partially offset by the 2002 charge for asset
impairment and exit costs ($25 million), higher marketing,
administration and research costs ($24 million, including higher
benefit costs) and higher manufacturing costs.
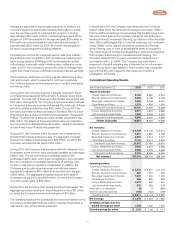
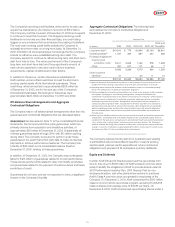
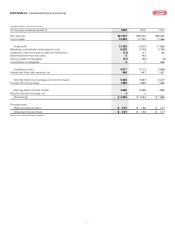
Kraft Foods International
(in millions)
For the Years Ended December 31, 2003 2002 2001
Volume (in pounds):
Europe, Middle East and Africa 2,971 2,961 2,826
Latin America and Asia Pacific 1,969 2,059 2,057
Volume (in pounds) 4,940 5,020 4,883
Net revenues:
Europe, Middle East and Africa $7,045 $6,203 $5,936
Latin America and Asia Pacific 2,058 2,035 2,328
Net revenues $9,103 $8,238 $8,264
Operating companies income:
Europe, Middle East and Africa $1,012 $962 $ 861
Latin America and Asia Pacific 270 368 378
Operating companies income $1,282 $1,330 $1,239
31