Kraft 2003 Annual Report Download - page 29
Download and view the complete annual report
Please find page 29 of the 2003 Kraft annual report below. You can navigate through the pages in the report by either clicking on the pages listed below, or by using the keyword search tool below to find specific information within the annual report.-
 1
1 -
2
-
3
-
4
-
5
-
6
-
7
-
8
-
9
-
10
-
11
-
12
-
13
-
14
-
15
-
16
-
17
-
18
-
 19
19 -
 20
20 -
 21
21 -
 22
22 -
 23
23 -
 24
24 -
 25
25 -
 26
26 -
 27
27 -
 28
28 -
 29
29 -
 30
30 -
 31
31 -
 32
32 -
 33
33 -
 34
34 -
 35
35 -
 36
36 -
 37
37 -
 38
38 -
 39
39 -
40
-
41
-
42
-
43
-
44
-
45
-
46
-
47
-
48
-
49
-
50
-
51
-
52
-
53
-
54
-
55
-
56
-
57
-
58
-
59
-
60
-
61
-
62
-
63
-
64
-
65
-
66
 |
 |

27
charges are expected to require cash payments. In addition, the
Company expects to spend approximately $140 million in capital
over the next three years to implement the program, including
approximately $50 million in 2004. Cost savings as a result of this
program in 2004 are expected to be approximately $120 million to
$140 million and are anticipated to reach annual cost savings of
approximately $400 million by 2006, all of which are expected to
be used in supporting brand-building initiatives.
Fluctuations in commodity prices can lead to retail price volatility
and intensive price competition, and can influence consumer and
trade buying patterns. KFNA’s and KFI’s businesses are subject
to fluctuating commodity costs, including dairy, coffee and cocoa
costs. In 2003, the Company’s commodity costs on average were
higher than those incurred in 2002 and adversely affected earnings.
The Company’s performance in 2003 was also affected by a rising
cost environment, which is expected to continue. In particular,
the Company experienced increased pension, medical, packaging
and energy costs.
During 2003, the Company acquired a biscuits business in Egypt
and trademarks associated with a small U.S.-based natural foods
business. The total cost of these and other smaller acquisitions was
$98 million. During 2002, the Company acquired a snacks business
in Turkey and a biscuits business in Australia. The total cost of these
and other smaller acquisitions was $122 million. During 2001, the
Company purchased coffee businesses in Romania, Morocco and
Bulgaria and also acquired confectionery businesses in Russia and
Poland. The total cost of these and other smaller acquisitions was
$194 million. The effects of these acquisitions were not material to
the Company’s consolidated financial position, results of operations
or cash flows in any of the periods presented.
During 2003, the Company sold a European rice business and a
branded fresh cheese business in Italy. The aggregate proceeds
received from sales of businesses were $96 million, on which the
Company recorded pre-tax gains of $31 million.
During 2002, the Company sold several small North American food
businesses, some of which were previously classified as businesses
held for sale. The net revenues and operating results of the
businesses held for sale, which were not significant, were excluded
from the Company’s consolidated statements of earnings, and
no gain or loss was recognized on these sales. In addition, the
Company sold its Latin American yeast and industrial bakery
ingredients business for $110 million and recorded a pre-tax gain
of $69 million. The aggregate proceeds received from sales of
businesses during 2002 were $219 million, on which the Company
recorded pre-tax gains of $80 million.
During 2001, the Company sold several small food businesses. The
aggregate proceeds received in these transactions were $21 million,
on which the Company recorded pre-tax gains of $8 million.
The operating results of the businesses sold were not material to the
Company’s consolidated financial position, results of operations or
cash flows in any of the periods presented.
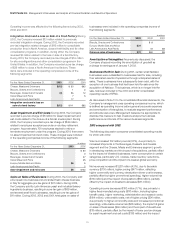
In November 2003, the Company was advised by the Fort Worth
District Office of the Securities and Exchange Commission (“SEC”)
that the staff is considering recommending that the SEC bring a civil
injunctive action against the Company charging it with aiding and
abetting Fleming Companies (“Fleming”) in violations of the securities
laws. District staff alleges that a Company employee, who received a
similar “Wells” notice, signed documents requested by Fleming,
which Fleming used in order to accelerate its revenue recognition.
The notice does not contain any allegations or statements regarding
the Company’s accounting for transactions with Fleming. The
Company believes that it properly recorded the transactions in
accordance with U.S. GAAP. The Company has submitted a
response to the staff indicating why it believes that no enforcement
action should be brought against it. The Company has cooperated
fully with the SEC with respect to this matter and the SEC’s
investigation of Fleming.
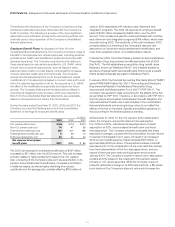
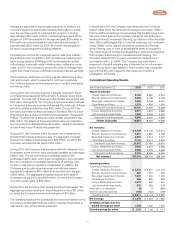
Consolidated Operating Results
(in millions, except per share data)
Year Ended December 31, 2003 2002 2001
Volume (in pounds):
Cheese, Meals and Enhancers 6,183 6,082 5,404
Biscuits, Snacks and Confectionery 2,083 2,185 2,165
Beverages, Desserts and Cereals 3,905 3,708 3,421
Oscar Mayer and Pizza 1,570 1,554 1,519
Total Kraft Foods North America 13,741 13,529 12,509
Europe, Middle East and Africa 2,971 2,961 2,826
Latin America and Asia Pacific 1,969 2,059 2,057
Total Kraft Foods International 4,940 5,020 4,883
Volume (in pounds) 18,681 18,549 17,392
Net revenues:
Cheese, Meals and Enhancers $9,439 $9,172 $ 9,014
Biscuits, Snacks and Confectionery 4,801 4,887 4,789
Beverages, Desserts and Cereals 4,567 4,412 4,237
Oscar Mayer and Pizza 3,100 3,014 2,930
Total Kraft Foods North America 21,907 21,485 20,970
Europe, Middle East and Africa 7,045 6,203 5,936
Latin America and Asia Pacific 2,058 2,035 2,328
Total Kraft Foods International 9,103 8,238 8,264
Net revenues $31,010 $29,723 $29,234
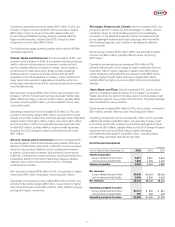
Operating income:
Operating companies income:
Cheese, Meals and Enhancers $2,230 $2,210 $ 2,132
Biscuits, Snacks and Confectionery 887 1,051 933
Beverages, Desserts and Cereals 1,247 1,136 1,192
Oscar Mayer and Pizza 556 556 539
Europe, Middle East and Africa 1,012 962 861
Latin America and Asia Pacific 270 368 378
Amortization of intangibles (9) (7) (962)
General corporate expenses (182) (162) (189)
Operating income $6,011 $6,114 $ 4,884
Net earnings $ 3,476 $3,394 $ 1,882
Weighted average shares for
diluted earnings per share 1,728 1,736 1,610
Diluted earnings per share $ 2.01 $1.96 $ 1.17