Kraft 2003 Annual Report Download - page 35
Download and view the complete annual report
Please find page 35 of the 2003 Kraft annual report below. You can navigate through the pages in the report by either clicking on the pages listed below, or by using the keyword search tool below to find specific information within the annual report.-
 1
1 -
2
-
3
-
4
-
5
-
6
-
7
-
8
-
9
-
10
-
11
-
12
-
13
-
14
-
15
-
16
-
17
-
18
-
19
-
20
-
21
-
22
-
23
-
24
-
 25
25 -
 26
26 -
 27
27 -
 28
28 -
 29
29 -
 30
30 -
 31
31 -
 32
32 -
 33
33 -
 34
34 -
 35
35 -
 36
36 -
 37
37 -
 38
38 -
 39
39 -
 40
40 -
 41
41 -
 42
42 -
 43
43 -
 44
44 -
 45
45 -
46
-
47
-
48
-
49
-
50
-
51
-
52
-
53
-
54
-
55
-
56
-
57
-
58
-
59
-
60
-
61
-
62
-
63
-
64
-
65
-
66
 |
 |

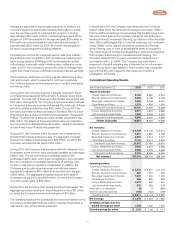
2002 compared with 2001
The following discussion compares KFI’s operating results for 2002
with 2001.
KFI’s volume increased 2.8% due primarily to acquisitions, new
product introductions, geographic expansion and marketing
programs. This increase in volume was partially offset by the impact
of economic weakness in several Latin American countries and the
impact of businesses sold.
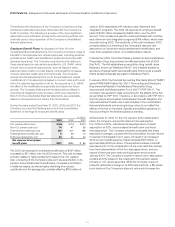
Net revenues decreased $26 million (0.3%), due primarily to
unfavorable currency movements ($271 million), lower volume/mix
($36 million) and revenues of divested businesses ($22 million),
partially offset by the impact of acquisitions ($181 million) and higher
net pricing ($122 million).
Operating companies income increased $91 million (7.3%), due
primarily to gains on sales of businesses ($64 million), favorable
margins ($37 million, including productivity savings), lower
marketing, administration and research costs ($23 million, including
synergy savings) and the impact of acquisitions ($18 million), partially
offset by lower volume/mix ($19 million), 2002 integration costs
($17 million) and income of divested businesses ($8 million).
The following discusses operating results within each of KFI’s
reportable segments.
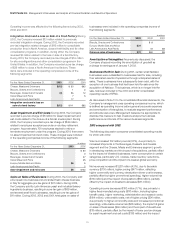
Europe, Middle East and Africa: Volume increased 4.8%, driven
by acquisitions and volume growth across most markets including
Italy, the United Kingdom, Sweden, the Ukraine, the Middle East
and Poland, partially offset by declines in Germany and Romania.
Snacks volume increased, benefiting from confectionery acquisitions
in Russia and Poland, a snacks acquisition in Turkey and new
product introductions across the segment. Snacks volume growth
was moderated by a decline in Germany, reflecting aggressive
competitive activity, and in Romania, due to lower consumer
purchasing power. In beverages, volume increased in both coffee
and refreshment beverages. Coffee volume grew in most markets,
driven by new product introductions, and acquisitions in Romania,
Morocco and Bulgaria. In Germany, coffee volume decreased,
reflecting market softness and increased price competition.
Refreshment beverages volume also increased, driven by the
geographic expansion of powdered beverages and new product
introductions. Cheese volume increased with gains in Philadelphia
cream cheese, benefiting from advertising and new product
introductions. In convenient meals, volume increased, due primarily
to higher canned meats volume in Italy against a weak comparison
in 2001, and new product introductions of lunch combinations in
the United Kingdom.
Net revenues increased $267 million (4.5%), due primarily to
favorable currency movements ($197 million), the acquisitions of
coffee, confectionery and snacks businesses ($147 million) and
higher volume/mix ($22 million), partially offset by lower net
pricing ($99 million, due primarily to commodity-driven coffee
price declines).
Operating companies income increased $101 million (11.7%), due
primarily to favorable margins ($42 million), favorable currency
movements ($37 million), higher volume/mix ($19 million) and
acquisitions ($16 million), partially offset by higher marketing,
administration and research costs.
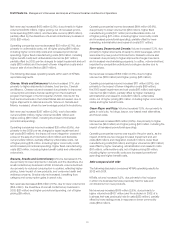
Latin America and Asia Pacific: Volume increased slightly, as
the acquisition of a biscuits business in Australia and gains across
numerous markets were partially offset by a volume decline in
Argentina due to economic weakness, lower results in China and
the impact of businesses sold. In snacks, volume growth was
driven by gains in biscuits, benefiting from geographic expansion of
cookies and crackers in Latin America, new product introductions
and the acquisition of a biscuits business in Australia. Snacks
volume growth was partially offset by the negative impact of the
continued economic weakness in Argentina and distributor inventory
reductions in China. Beverages volume also increased, due primarily
to growth in powdered beverages in numerous markets across
Latin America and Asia Pacific, which benefited from new product
introductions. In grocery, volume declined in both Latin America
and Asia Pacific.
Net revenues decreased $293 million (12.6%), due primarily to
unfavorable currency movements ($468 million), lower volume/mix
($58 million) and revenues from divested businesses ($22 million),
partially offset by higher net pricing ($221 million) and the 2002
acquisition of a biscuits business in Australia ($34 million).
Operating companies income decreased $10 million (2.6%), due
primarily to lower volume/mix ($38 million), unfavorable currency
movements ($37 million), 2002 integration costs ($17 million) and
the operating companies income of disposed businesses, partially
offset by gains on sales of businesses ($64 million) and lower
marketing, administration and research costs ($31 million, including
synergy savings).
Financial Review
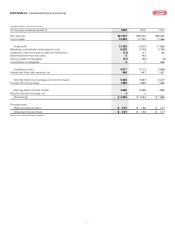
Net Cash Provided by Operating Activities
Net cash provided by operating activities was $4.1 billion in 2003,
$3.7 billion in 2002 and $3.3 billion in 2001. The increase in 2003
operating cash flows over 2002 was due primarily to a lower use of
cash to fund working capital, partially offset by increased pension
contributions. The increase in 2002 operating cash flows over 2001
primarily reflected cash flow from increased net earnings.
Net Cash Used in Investing Activities
One element of the growth strategy of the Company is to
strengthen its brand portfolios through disciplined programs of
selective acquisitions and divestitures. The Company is constantly
investigating potential acquisition candidates and from time to
time sells businesses that are outside its core categories or that
do not meet its growth or profitability targets.
33