Kraft 2003 Annual Report Download - page 31
Download and view the complete annual report
Please find page 31 of the 2003 Kraft annual report below. You can navigate through the pages in the report by either clicking on the pages listed below, or by using the keyword search tool below to find specific information within the annual report.-
 1
1 -
2
-
3
-
4
-
5
-
6
-
7
-
8
-
9
-
10
-
11
-
12
-
13
-
14
-
15
-
16
-
17
-
18
-
19
-
20
-
 21
21 -
 22
22 -
 23
23 -
 24
24 -
 25
25 -
 26
26 -
 27
27 -
 28
28 -
 29
29 -
 30
30 -
 31
31 -
 32
32 -
 33
33 -
 34
34 -
 35
35 -
 36
36 -
 37
37 -
 38
38 -
 39
39 -
 40
40 -
 41
41 -
42
-
43
-
44
-
45
-
46
-
47
-
48
-
49
-
50
-
51
-
52
-
53
-
54
-
55
-
56
-
57
-
58
-
59
-
60
-
61
-
62
-
63
-
64
-
65
-
66
 |
 |

from integration costs and a loss on sale of a food factory ($124 mil-
lion) and favorable currency ($94 million). The higher benefit costs
were primarily related to pension and stock compensation costs.
Currency movements increased net revenues by $730 million and
operating income by $94 million. These increases were due primarily
to the further weakening of the U.S. dollar against the euro, the
Canadian dollar and other currencies, partially offset by the strength
of the U.S. dollar against certain Latin American currencies.
Interest and other debt expense, net, decreased $182 million. This
decrease is due to the Company’s refinancing of notes payable to
Altria Group, Inc. and the use of free cash flow to pay down debt.
The Company’s reported effective tax rate decreased by 0.6
percentage points to 34.9%, due primarily to rate differences from
foreign operations.
Net earnings of $3,476 million increased $82 million (2.4%), due
primarily to lower interest expense and a lower effective tax rate,
partially offset by lower operating income. Diluted and basic earnings
per share (“EPS”), which were both $2.01, increased by 2.6%.
2002 compared with 2001
The following discussion compares consolidated operating results
for 2002 with 2001.
Volume increased 1,157 million pounds (6.7%), due primarily to the
inclusion in 2002 of a business previously considered held for sale,
new product introductions, geographic expansion and acquisitions.
Net revenues increased $489 million (1.7%), due primarily to higher
volume/mix ($401 million), the inclusion in 2002 of a business
previously considered held for sale ($252 million) and the impact of
acquisitions ($191 million), partially offset by the adverse effect of
currency exchange rates ($291 million) and lower sales prices on
cheese and coffee products (driven by commodity-related declines).
Operating income increased $1,230 million (25.2%), due primarily
to the elimination of substantially all goodwill amortization, volume
growth and favorable margins.
Currency movements decreased net revenues by $291 million and
operating income by $4 million. These decreases in net revenues
and operating income were due primarily to the strength of the
U.S. dollar against certain Latin American currencies, partially
offset by the weakness of the U.S. dollar against the euro and
other currencies.
Interest and other debt expense, net, decreased $590 million. This
decrease was due primarily to lower debt levels after the repayment
of Nabisco acquisition borrowings with the proceeds from the
Company’s IPO, as well as the Company’s refinancing of notes
payable to Altria Group, Inc. and lower short-term interest rates.
The Company’s effective tax rate decreased by 9.9 percentage
points to 35.5%, due primarily to the adoption of SFAS No. 141 and
SFAS No. 142, under which the Company is no longer required to
amortize goodwill as a charge to earnings.
Net earnings of $3,394 million increased $1,512 million (80.3%), due
primarily to growth in operating income and lower interest expense.
Diluted and basic EPS, which were both $1.96, increased by 67.5%.
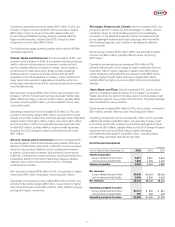
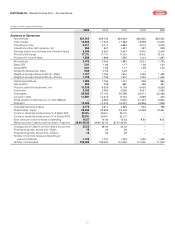
Operating Results by Reportable Segment
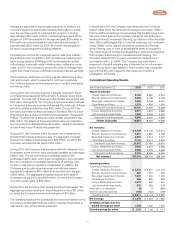
Kraft Foods North America
(in millions)
For the Years Ended December 31, 2003 2002 2001
Volume (in pounds):
Cheese, Meals and Enhancers 6,183 6,082 5,404
Biscuits, Snacks and Confectionery 2,083 2,185 2,165
Beverages, Desserts and Cereals 3,905 3,708 3,421
Oscar Mayer and Pizza 1,570 1,554 1,519
Volume (in pounds) 13,741 13,529 12,509
Net revenues:
Cheese, Meals and Enhancers $9,439 $9,172 $ 9,014
Biscuits, Snacks and Confectionery 4,801 4,887 4,789
Beverages, Desserts and Cereals 4,567 4,412 4,237
Oscar Mayer and Pizza 3,100 3,014 2,930
Net revenues $21,907 $21,485 $20,970
Operating companies income:
Cheese, Meals and Enhancers $2,230 $2,210 $ 2,132
Biscuits, Snacks and Confectionery 887 1,051 933
Beverages, Desserts and Cereals 1,247 1,136 1,192
Oscar Mayer and Pizza 556 556 539
Operating companies income $ 4,920 $4,953 $ 4,796
2003 compared with 2002
The following discussion compares KFNA’s operating results for
2003 with 2002.
During the first quarter of 2003, the Company transferred
management responsibility of its Canadian Biscuits and Pet Snacks
operations from the Biscuits, Snacks and Confectionery segment to
the Cheese, Meals and Enhancers segment, which contains the
Company’s other Canadian businesses. Accordingly, all prior period
amounts have been reclassified to reflect the transfer.
Volume increased 1.6%, due primarily to contributions from new
products and increased shipments in the Beverages, Desserts and
Cereals segment and the Cheese, Meals and Enhancers segment,
partially offset by the divestiture of a small confectionery business in
2002, consumption weakness in certain categories, primarily
cookies, and trade inventory reductions.
29