Kraft 2003 Annual Report Download - page 54
Download and view the complete annual report
Please find page 54 of the 2003 Kraft annual report below. You can navigate through the pages in the report by either clicking on the pages listed below, or by using the keyword search tool below to find specific information within the annual report.-
 1
1 -
2
-
3
-
4
-
5
-
6
-
7
-
8
-
9
-
10
-
11
-
12
-
13
-
14
-
15
-
16
-
17
-
18
-
19
-
20
-
21
-
22
-
23
-
24
-
25
-
26
-
27
-
28
-
29
-
30
-
31
-
32
-
33
-
34
-
35
-
36
-
37
-
38
-
39
-
40
-
41
-
42
-
43
-
 44
44 -
 45
45 -
 46
46 -
 47
47 -
 48
48 -
 49
49 -
 50
50 -
 51
51 -
 52
52 -
 53
53 -
 54
54 -
 55
55 -
 56
56 -
 57
57 -
 58
58 -
 59
59 -
 60
60 -
 61
61 -
 62
62 -
 63
63 -
 64
64 -
65
-
66
 |
 |

52
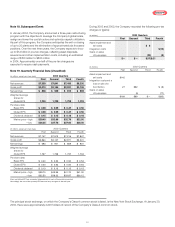
Kraft Foods Inc. Notes to Consolidated Financial Statements
The Company’s management uses operating companies income,
which is defined as operating income before general corporate
expenses and amortization of intangibles, to evaluate segment
performance and allocate resources. Interest and other debt
expense, net, and provision for income taxes are centrally managed
and, accordingly, such items are not presented by segment since
they are not included in the measure of segment profitability
reviewed by management. The Company’s assets, which are
principally in the United States and Europe, are managed
geographically. The accounting policies of the segments are the
same as those described in Note 2. Summary of Significant
Accounting Policies.
During the first quarter of 2003, the Company transferred
management responsibility of its Canadian Biscuits and Pet Snacks
operations from the Biscuits, Snacks and Confectionery segment to
the Cheese, Meals and Enhancers segment, which contains the
Company’s other Canadian businesses. Accordingly, all prior period
amounts have been reclassified to reflect the transfer. During
January 2004, the Company announced a new global organizational
structure, which will result in new segments for financial reporting
purposes. Beginning in 2004, the Company’s new segments will be
U.S. Beverages & Grocery; U.S. Snacks; U.S. Cheese, Canada &
North America Foodservice; U.S. Convenient Meals; Europe, Middle
East and Africa; and Latin America and Asia Pacific.
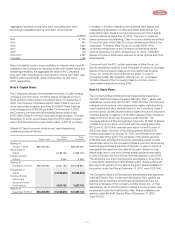
Segment data were as follows:
(in millions)
For the Years Ended December 31, 2003 2002 2001
Net revenues:
Cheese, Meals and Enhancers $9,439 $9,172 $ 9,014
Biscuits, Snacks and Confectionery 4,801 4,887 4,789
Beverages, Desserts and Cereals 4,567 4,412 4,237
Oscar Mayer and Pizza 3,100 3,014 2,930
Total Kraft Foods North America 21,907 21,485 20,970
Europe, Middle East and Africa 7,045 6,203 5,936
Latin America and Asia Pacific 2,058 2,035 2,328
Total Kraft Foods International 9,103 8,238 8,264
Net revenues $31,010 $29,723 $29,234
Earnings before income taxes and
minority interest:
Operating companies income:
Kraft Foods North America:
Cheese, Meals and Enhancers $2,230 $2,210 $2,132
Biscuits, Snacks and Confectionery 887 1,051 933
Beverages, Desserts and Cereals 1,247 1,136 1,192
Oscar Mayer and Pizza 556 556 539
Kraft Foods International:
Europe, Middle East and Africa 1,012 962 861
Latin America and Asia Pacific 270 368 378
Amortization of intangibles (9) (7) (962)
General corporate expenses (182) (162) (189)
Operating income 6,011 6,114 4,884
Interest and other debt expense, net (665) (847) (1,437)
Earnings before income taxes and
minority interest $5,346 $5,267 $ 3,447
The Company’s largest customer, Wal-Mart Stores, Inc. and its
affiliates, accounted for approximately 12%, 12% and 11% of
consolidated net revenues for 2003, 2002 and 2001, respectively.
These net revenues occurred primarily in the United States and were
across all segments.
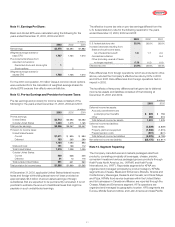
As previously noted, the Company’s international operations are
managed by geographic location. Within its two geographic regions,
KFI’s brand portfolio spans five core consumer sectors. Net
revenues by consumer sector for KFI were as follows:
Consumer Sector
(in millions)
For the Years Ended December 31, 2003 2002 2001
Snacks $3,622 $3,179 $3,077
Beverages 3,124 2,832 2,900
Cheese 1,302 1,202 1,208
Grocery 741 752 826
Convenient Meals 314 273 253
Total $9,103 $8,238 $8,264
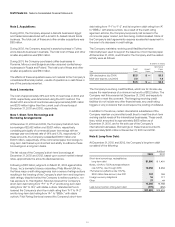
Items affecting the comparability of the Company’s results were
as follows:
• Integration Costs and a Loss on Sale of a Food Factory—During
2003, the Company reversed $13 million related to the previously
recorded integration charges. During 2002, the Company recorded
pre-tax integration-related charges of $115 million to consolidate
production lines in North America, close a Kraft facility and for other
consolidation programs. In addition, during 2002, the Company
reversed $4 million related to the loss on sale of a food factory.
During 2001, the Company recorded pre-tax charges of $53 million
for site reconfigurations and other consolidation programs in the
United States. In addition, the Company recorded a pre-tax charge
of $29 million to close a North American food factory. These items
were included in the operating companies income of the
following segments:
(in millions)
For the Years Ended December 31, 2003 2002 2001
Cheese, Meals and Enhancers $(10) $30 $63
Biscuits, Snacks and Confectionery 12
Beverages, Desserts and Cereals (3) 56 12
Oscar Mayer and Pizza 75
Latin America and Asia Pacific 17
Integration costs and a loss
on sale of a food factory $(13) $111 $82
• Asset Impairment and Exit Costs—During 2003, the Company
recorded a pre-tax charge of $6 million for asset impairment and exit
costs related to the closure of a Nordic snacks plant. During 2002,
the Company recorded a pre-tax charge of $142 million related to
employee acceptances under a voluntary retirement program.
Approximately 700 employees elected to retire or terminate
employment under the program. These charges were included in the