Kraft 2003 Annual Report Download - page 57
Download and view the complete annual report
Please find page 57 of the 2003 Kraft annual report below. You can navigate through the pages in the report by either clicking on the pages listed below, or by using the keyword search tool below to find specific information within the annual report.-
 1
1 -
2
-
3
-
4
-
5
-
6
-
7
-
8
-
9
-
10
-
11
-
12
-
13
-
14
-
15
-
16
-
17
-
18
-
19
-
20
-
21
-
22
-
23
-
24
-
25
-
26
-
27
-
28
-
29
-
30
-
31
-
32
-
33
-
34
-
35
-
36
-
37
-
38
-
39
-
40
-
41
-
42
-
43
-
44
-
45
-
46
-
 47
47 -
 48
48 -
 49
49 -
 50
50 -
 51
51 -
 52
52 -
 53
53 -
 54
54 -
 55
55 -
 56
56 -
 57
57 -
 58
58 -
 59
59 -
 60
60 -
 61
61 -
 62
62 -
 63
63 -
 64
64 -
 65
65 -
 66
66
 |
 |

55
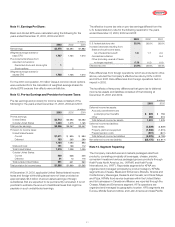
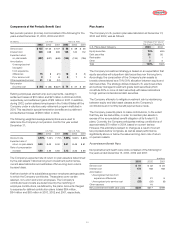
Components of Net Periodic Benefit Cost
Net periodic pension (income) cost consisted of the following for the
years ended December 31, 2003, 2002 and 2001:
(in millions) U.S. Plans Non-U.S. Plans
2003 2002 2001 2003 2002 2001
Service cost $135 $120 $ 107 $58 $49 $45
Interest cost 338 339 339 136 120 112
Expected return
on plan assets (587) (631) (648) (146) (134) (126)
Amortization:
Unrecognized net
loss (gain)
from experience
differences 15 8(21) 18 5(1)
Prior service cost 218875
Other expense (income) 51 130 (12)
Net pension
(income) cost $(46) $(33) $(227) $74 $47 $35
Retiring employees elected lump-sum payments, resulting in
settlement losses of $51 million and $21 million in 2003 and 2002,
respectively, and settlement gains of $12 million in 2001. In addition,
during 2002, certain salaried employees in the United States left the
Company under a voluntary early retirement program instituted in
2001. This resulted in special termination benefits and curtailment
and settlement losses of $109 million in 2002.
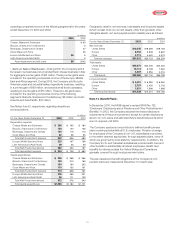
The following weighted-average assumptions were used to
determine the Company’s net pension cost for the year ended
December 31:
U.S. Plans Non-U.S. Plans
2003 2002 2001 2003 2002 2001
Discount rate 6.50% 7.00% 7.75% 5.56% 5.80% 5.88%
Expected rate of
return on plan assets 9.00 9.00 9.00 8.41 8.49 8.51
Rate of compensation
increase 4.00 4.50 4.50 3.12 3.36 3.55
The Company’s expected rate of return on plan assets is determined
by the plan assets’ historical long-term investment performance,
current asset allocation and estimates of future long-term returns
by asset class.
Kraft and certain of its subsidiaries sponsor employee savings plans,
to which the Company contributes. These plans cover certain
salaried, non-union and union employees. The Company’s
contributions and costs are determined by the matching of
employee contributions, as defined by the plans. Amounts charged
to expense for defined contribution plans totaled $84 million,
$64 million and $63 million in 2003, 2002 and 2001, respectively.
Plan Assets
The Company’s U.S. pension plan asset allocation at December 31,
2003 and 2002, was as follows:
Percentage of Fair Value of
Plan Assets at December 31
U.S. Plans Asset Category 2003 2002
Equity securities 70% 63%
Debt securities 26 32
Real estate 11
Other 34
Total 100% 100%
The Company’s investment strategy is based on an expectation that
equity securities will outperform debt securities over the long term.
Accordingly, the composition of the Company’s plan assets is
broadly characterized as a 70%/30% allocation between equity and
debt securities. The strategy utilizes indexed U.S. equity securities
and actively managed investment grade debt securities (which
constitute 80% or more of debt securities) with lesser allocations
to high yield and international debt securities.
The Company attempts to mitigate investment risk by rebalancing
between equity and debt asset classes as the Company’s
contributions and monthly benefit payments are made.
The Company presently plans to make contributions, to the extent
that they are tax deductible, in order to maintain plan assets in
excess of the accumulated benefit obligation of its funded U.S.
plans. Currently, the Company anticipates making contributions of
approximately $70 million in 2004, based on current tax law.
However, this estimate is subject to change as a result of current
tax proposals before Congress, as well as asset performance
significantly above or below the assumed long-term rate of return
on pension assets.
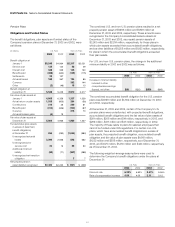
Postretirement Benefit Plans
Net postretirement health care costs consisted of the following for
the years ended December 31, 2003, 2002 and 2001:
(in millions)
2003 2002 2001
Service cost $41 $32 $34
Interest cost 173 168 168
Amortization:
Unrecognized net loss from
experience differences 40 21 5
Unrecognized prior service cost (25) (20) (8)
Other expense 16
Net postretirement health care costs $229 $217 $199