Kraft 2003 Annual Report Download - page 30
Download and view the complete annual report
Please find page 30 of the 2003 Kraft annual report below. You can navigate through the pages in the report by either clicking on the pages listed below, or by using the keyword search tool below to find specific information within the annual report.-
 1
1 -
2
-
3
-
4
-
5
-
6
-
7
-
8
-
9
-
10
-
11
-
12
-
13
-
14
-
15
-
16
-
17
-
18
-
19
-
 20
20 -
 21
21 -
 22
22 -
 23
23 -
 24
24 -
 25
25 -
 26
26 -
 27
27 -
 28
28 -
 29
29 -
 30
30 -
 31
31 -
 32
32 -
 33
33 -
 34
34 -
 35
35 -
 36
36 -
 37
37 -
 38
38 -
 39
39 -
 40
40 -
41
-
42
-
43
-
44
-
45
-
46
-
47
-
48
-
49
-
50
-
51
-
52
-
53
-
54
-
55
-
56
-
57
-
58
-
59
-
60
-
61
-
62
-
63
-
64
-
65
-
66
 |
 |

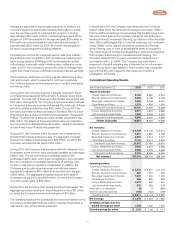
Kraft Foods Inc. Management’s Discussion and Analysis of Financial Condition and Results of Operations
Operating income was affected by the following items during 2003,
2002 and 2001:
Integration Costs and a Loss on Sale of a Food Factory: During
2003, the Company reversed $13 million related to previously
recorded integration charges. During 2002, the Company recorded
pre-tax integration related charges of $115 million to consolidate
production lines in North America, close a Kraft facility and for other
consolidation programs. In addition, during 2002, the Company
reversed $4 million related to the loss on sale of a food factory.
During 2001, the Company recorded pre-tax charges of $53 million
for site reconfigurations and other consolidation programs in the
United States. In addition, the Company recorded a pre-tax charge
of $29 million to close a North American food factory. These
items were included in the operating companies income of the
following segments:
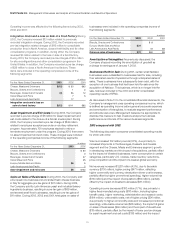
(in millions)
For the Years Ended December 31, 2003 2002 2001
Cheese, Meals and Enhancers $(10) $30 $63
Biscuits, Snacks and Confectionery 12
Beverages, Desserts and Cereals (3) 56 12
Oscar Mayer and Pizza 75
Latin America and Asia Pacific 17
Integration costs and a loss on
sale of a food factory $(13) $111 $82
Asset Impairment and Exit Costs: During 2003, the Company
recorded a pre-tax charge of $6 million for asset impairment and
exit costs related to the closure of a Nordic snacks plant. During
2002, the Company recorded a pre-tax charge of $142 million
related to employee acceptances under a voluntary retirement
program. Approximately 700 employees elected to retire or
terminate employment under the program. During 2001, there were
no asset impairment and exit costs. These charges were included
in the operating companies income of the following segments:
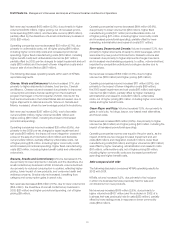
(in millions)
For the Years Ended December 31, 2003 2002
Cheese, Meals and Enhancers $60
Biscuits, Snacks and Confectionery 3
Beverages, Desserts and Cereals 47
Oscar Mayer and Pizza 25
Europe, Middle East and Africa $6 5
Latin America and Asia Pacific 2
Asset impairment and exit costs $6 $142
Gains on Sales of Businesses: During 2003, the Company sold
aEuropean rice business and a branded fresh cheese business
in Italy for aggregate pre-tax gains of $31 million. During 2002,
the Company sold its Latin American yeast and industrial bakery
ingredients business, resulting in a pre-tax gain of $69 million,
and several small food businesses, resulting in pre-tax gains of
$11 million. During 2003, 2002 and 2001, total gains on sales of
businesses were included in the operating companies income of
the following segments:
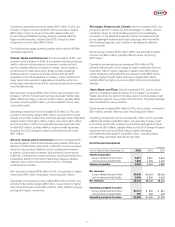
(in millions)
For the Years Ended December 31, 2003 2002 2001
Biscuits, Snacks and Confectionery $8
Europe, Middle East and Africa $31
Latin America and Asia Pacific 72 $8
Gains on sales of businesses $31 $80 $8
Amortization of Intangibles: As previously discussed, the
Company stopped recording the amortization of goodwill as
acharge to earnings as of January 1, 2002.
Businesses Held for Sale: During 2001, certain small Nabisco
businesses were reclassified to businesses held for sale, including
their estimated results of operations through anticipated dates of
sales. These businesses have subsequently been sold, with the
exception of one business that had been held for sale since the
acquisition of Nabisco. This business, which is no longer held for
sale, has been included in the 2003 and 2002 consolidated
operating results of KFNA.
As discussed in Note 13 to the consolidated financial statements, the
Company’s management uses operating companies income, which
is defined as operating income before general corporate expenses
and amortization of intangibles, to evaluate segment performance
and allocate resources. Management believes it is appropriate to
disclose this measure to help investors analyze the business
performance and trends of the various business segments.
2003 compared with 2002
The following discussion compares consolidated operating results
for 2003 with 2002.
Volume increased 132 million pounds (0.7%), due primarily to
increased shipments in the Beverages, Desserts and Cereals
segment and the Cheese, Meals and Enhancers segment, growth
in developing markets and the impact of acquisitions, partially offset
by the impact of divested businesses, lower consumption in certain
categories, particularly U.S. cookies, trade inventory reductions,
price competition and the impact of a weaker global economy.
Net revenues increased $1,287 million (4.3%), due to favorable
currency ($730 million), higher pricing ($471 million, reflecting
higher commodity and currency devaluation-driven cost increases,
partially offset by higher promotional spending), higher volume/mix
($114 million) and the impact of acquisitions ($59 million), partially
offset by the impact of divested businesses ($87 million).
Operating income decreased $103 million (1.7%), due primarily to
higher fixed manufacturing costs ($110 million, including higher
benefit costs), higher marketing, administration and research costs
($104 million), unfavorable costs, net of higher pricing ($94 million,
due primarily to higher commodity costs and increased promotional
spending), unfavorable volume/mix ($66 million), the impact of gains
on sales of businesses ($49 million) and the impact of divestitures
($18 million), partially offset by the impact of lower pre-tax charges
for asset impairment and exit costs ($136 million) and the impact
28