JetBlue Airlines 2007 Annual Report Download - page 46
Download and view the complete annual report
Please find page 46 of the 2007 JetBlue Airlines annual report below. You can navigate through the pages in the report by either clicking on the pages listed below, or by using the keyword search tool below to find specific information within the annual report.-
 1
1 -
2
-
3
-
4
-
5
-
6
-
7
-
8
-
9
-
10
-
11
-
12
-
13
-
14
-
15
-
16
-
17
-
18
-
19
-
20
-
21
-
22
-
23
-
24
-
25
-
26
-
27
-
28
-
29
-
30
-
31
-
32
-
33
-
34
-
35
-
 36
36 -
 37
37 -
 38
38 -
 39
39 -
 40
40 -
 41
41 -
 42
42 -
 43
43 -
 44
44 -
 45
45 -
 46
46 -
 47
47 -
 48
48 -
 49
49 -
 50
50 -
 51
51 -
 52
52 -
 53
53 -
 54
54 -
 55
55 -
 56
56 -
57
-
58
-
59
-
60
-
61
-
62
-
63
-
64
-
65
-
66
-
67
-
68
-
69
-
70
-
71
-
72
-
73
-
74
-
75
-
76
-
77
-
78
-
79
-
80
-
81
-
82
-
83
-
84
-
85
-
86
-
87
-
88
-
89
-
90
-
91
-
92
-
93
-
94
-
95
-
96
-
97
-
98
-
99
-
100
-
101
-
102
-
103
-
104
-
105
-
106
-
107
-
108
 |
 |

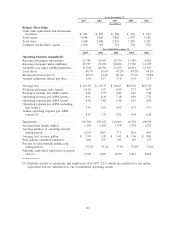
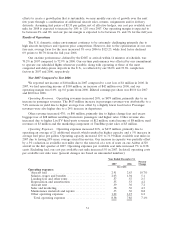
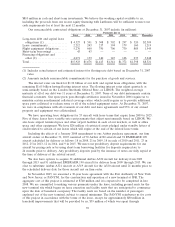
Three Months Ended
March 31,
2007
June 30,
2007
September 30,
2007
December 31,
2007
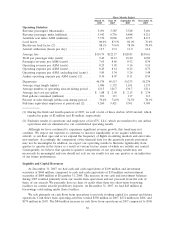
Operating Statistics:
Revenue passengers (thousands) ................... 5,091 5,587 5,528 5,181
Revenue passenger miles (millions)................. 5,942 6,736 6,848 6,211
Available seat miles ASM (millions) ................ 7,370 8,066 8,355 8,113
Load factor ..................................... 80.6%83.5%82.0%76.6%
Breakeven load factor (2) ......................... 88.1%79.6%78.0%78.4%
Aircraft utilization (hours per day) ................ 12.7 13.2 13.0 12.6
Average fare .................................... $110.79 $122.17 $128.83 $130.61
Yield per passenger mile (cents) ................... 9.49 10.13 10.40 10.89
Passenger revenue per ASM (cents) ................ 7.65 8.46 8.52 8.34
Operating revenue per ASM (cents) ................ 8.25 9.05 9.16 9.10
Operating expense per ASM (cents) ................ 8.43 8.14 8.22 8.73
Operating expense per ASM, excluding fuel (cents) . . 5.85 5.34 5.24 5.48
Airline operating expense per ASM (cents) (2) ...... 8.36 8.07 8.11 8.54
Departures ..................................... 46,574 49,513 50,233 50,274
Average stage length (miles) ...................... 1,086 1,135 1,161 1,133
Average number of operating aircraft during period . . 121.5 126.7 130.7 132.1
Average fuel cost per gallon ...................... $ 1.88 $ 2.00 $ 2.13 $ 2.34
Fuel gallons consumed (millions) .................. 101 113 117 113
Percent of sales through jetblue.com during period . . . 76.4%74.0%74.5%78.1%
Full-time equivalent employees at period end (2)..... 9,260 9,421 9,301 9,909
(1) During the third and fourth quarters of 2007, we sold a total of three Airbus A320 aircraft, which
resulted in gains of $2 million and $5 million, respectively.
(2) Excludes results of operations and employees of LiveTV, LLC, which are unrelated to our airline
operations and are immaterial to our consolidated operating results.
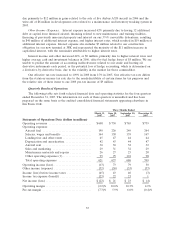
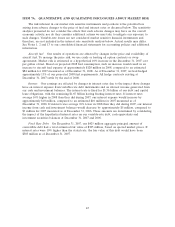
Although we have continued to experience significant revenue growth, this trend may not
continue. We expect our expenses to continue to increase significantly as we acquire additional
aircraft, as our fleet ages and as we expand the frequency of flights in existing markets and enter into
new markets. Accordingly, the comparison of the financial data for the quarterly periods presented
may not be meaningful. In addition, we expect our operating results to fluctuate significantly from
quarter to quarter in the future as a result of various factors, many of which are outside our control.
Consequently, we believe that quarter-to-quarter comparisons of our operating results may not
necessarily be meaningful and you should not rely on our results for any one quarter as an indication
of our future performance.
Liquidity and Capital Resources
At December 31, 2007, we had cash and cash equivalents of $190 million and investment
securities of $644 million, compared to cash and cash equivalents of $10 million and investment
securities of $689 million at December 31, 2006. The increase in our cash and investment balances
during 2007 resulted primarily from our results from operations and net proceeds from the sale of
three of our aircraft. We presently have no lines of credit other than two short-term borrowing
facilities for certain aircraft predelivery deposits. At December 31, 2007, we had $43 million in
borrowings outstanding under these facilities.
We rely primarily on cash flows from operations to provide working capital for current and future
operations. Cash flows from operating activities totaled $358 million in 2007, $274 million in 2006, and
$170 million in 2005. The $84 million increase in cash flows from operations in 2007 compared to 2006
36