JetBlue Airlines 2007 Annual Report Download - page 44
Download and view the complete annual report
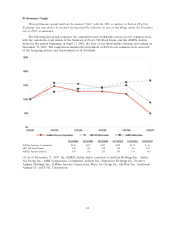
Please find page 44 of the 2007 JetBlue Airlines annual report below. You can navigate through the pages in the report by either clicking on the pages listed below, or by using the keyword search tool below to find specific information within the annual report.-
 1
1 -
2
-
3
-
4
-
5
-
6
-
7
-
8
-
9
-
10
-
11
-
12
-
13
-
14
-
15
-
16
-
17
-
18
-
19
-
20
-
21
-
22
-
23
-
24
-
25
-
26
-
27
-
28
-
29
-
30
-
31
-
32
-
33
-
 34
34 -
 35
35 -
 36
36 -
 37
37 -
 38
38 -
 39
39 -
 40
40 -
 41
41 -
 42
42 -
 43
43 -
 44
44 -
 45
45 -
 46
46 -
 47
47 -
 48
48 -
 49
49 -
 50
50 -
 51
51 -
 52
52 -
 53
53 -
 54
54 -
55
-
56
-
57
-
58
-
59
-
60
-
61
-
62
-
63
-
64
-
65
-
66
-
67
-
68
-
69
-
70
-
71
-
72
-
73
-
74
-
75
-
76
-
77
-
78
-
79
-
80
-
81
-
82
-
83
-
84
-
85
-
86
-
87
-
88
-
89
-
90
-
91
-
92
-
93
-
94
-
95
-
96
-
97
-
98
-
99
-
100
-
101
-
102
-
103
-
104
-
105
-
106
-
107
-
108
 |
 |
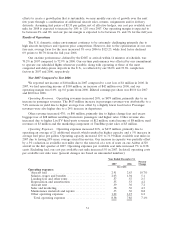
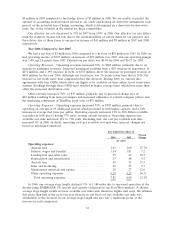
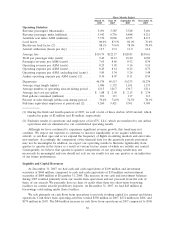
Aircraft fuel expense increased 54%, or $264 million, due to 74 million more gallons of aircraft
fuel consumed resulting in $119 million of additional fuel expense and a 24%increase in average fuel
cost per gallon, or $145 million. Aircraft fuel prices remained at or near historically high levels in
2006, with our average fuel price per gallon at $1.99 compared to $1.61 for the year ended
December 31, 2005. Our fuel costs represented 34%and 30%of our operating expenses in 2006 and
2005, respectively. Our fuel consumption per block hour decreased 5%due to utilization of the lighter
EMBRAER 190 aircraft and various fuel conservation initiatives. Based on our expected fuel volume
for 2007, a $0.10 per gallon increase in the cost of aircraft fuel would increase our annual fuel expense
by approximately $45 million. Cost per available seat mile increased 28%primarily due to the increase
in average fuel cost per gallon.
Salaries, wages and benefits increased 29%, or $125 million, due primarily to an increase in
average full-time equivalent employees of 25%in 2006 compared to 2005 and a $12 million increase in
non-cash stock-based compensation expense. We recorded $3 million of profit sharing in 2006
compared to none in 2005. Cost per available seat mile increased 7%as a result of stock-based
compensation expense and profit sharing.
Effective January 1, 2006, we adopted Statement of Financial Accounting Standards No. 123(R),
Share-Based Payment, and related interpretations, or SFAS 123(R), which requires us to record the
fair value of stock options granted under our 2002 Stock Incentive Plan and purchase rights issued
under our stock purchase plan. Because we elected to use the modified prospective transition method,
results for prior periods have not been restated. At December 31, 2006, there was $35 million of total
unrecognized compensation cost related to non-vested share-based compensation arrangements
granted under all of our equity compensation plans. Total unrecognized compensation cost will be
adjusted for future changes in estimated forfeitures. We expect to recognize that cost over the
remaining vesting period of five years. See Notes 1 and 7 to our consolidated financial statements for
more information regarding the adoption of this accounting standard.
Landing fees and other rents increased 41%, or $46 million, due to a 42%increase in departures
over 2005 and increased airport rents associated with opening 16 new cities in 2006. Cost per available
seat mile increased 17%due to ground rents associated with our new terminal under construction at
JFK.
Depreciation and amortization increased 32%, or $36 million, primarily due to having an average
of 67 owned and capital leased aircraft in 2006 compared to 52 in 2005 and the associated
depreciation of our seven-gate temporary facility at JFK, which was placed into service in June 2006.
Cost per available seat mile increased 9%primarily due to our temporary facility at JFK, partially
offset by a lower percentage of our fleet being owned or under capital lease.
Aircraft rent increased 39%, or $29 million, due to 16 new EMBRAER 190 aircraft leases. Cost
per available seat mile increased 15%due to a higher percentage of our fleet being leased.
Sales and marketing expense increased 27%, or $23 million, primarily due to $16 million in higher
credit card fees resulting from increased passenger revenues and $6 million in increased advertising
expenses. On a cost per available seat mile basis, sales and marketing expense increased 5%primarily
due to higher credit card fees resulting from higher average fares. We book the majority of our
reservations through a combination of our website and our agents (79%and 19%in 2006,
respectively).
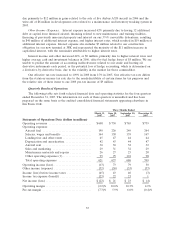
Maintenance materials and repairs increased 36%, or $23 million, due to 29 more average
operating aircraft in 2006 compared to 2005 and a gradual aging of our fleet. Cost per available seat
mile increased 13%year-over-year due primarily to operating under airframe parts maintenance
third-party contracts in 2006, one-time warranty coverage on our engines in 2005 and outsourced line
maintenance for the 16 new cities we opened in 2006. Maintenance costs are expected to increase
significantly as our fleet ages.
Other operating expenses increased 13%, or $37 million, due to higher variable costs associated
with increased capacity and number of passengers served. Cost per available seat mile decreased 7%
34