JetBlue Airlines 2007 Annual Report Download - page 42
Download and view the complete annual report
Please find page 42 of the 2007 JetBlue Airlines annual report below. You can navigate through the pages in the report by either clicking on the pages listed below, or by using the keyword search tool below to find specific information within the annual report.-
 1
1 -
2
-
3
-
4
-
5
-
6
-
7
-
8
-
9
-
10
-
11
-
12
-
13
-
14
-
15
-
16
-
17
-
18
-
19
-
20
-
21
-
22
-
23
-
24
-
25
-
26
-
27
-
28
-
29
-
30
-
31
-
 32
32 -
 33
33 -
 34
34 -
 35
35 -
 36
36 -
 37
37 -
 38
38 -
 39
39 -
 40
40 -
 41
41 -
 42
42 -
 43
43 -
 44
44 -
 45
45 -
 46
46 -
 47
47 -
 48
48 -
 49
49 -
 50
50 -
 51
51 -
 52
52 -
53
-
54
-
55
-
56
-
57
-
58
-
59
-
60
-
61
-
62
-
63
-
64
-
65
-
66
-
67
-
68
-
69
-
70
-
71
-
72
-
73
-
74
-
75
-
76
-
77
-
78
-
79
-
80
-
81
-
82
-
83
-
84
-
85
-
86
-
87
-
88
-
89
-
90
-
91
-
92
-
93
-
94
-
95
-
96
-
97
-
98
-
99
-
100
-
101
-
102
-
103
-
104
-
105
-
106
-
107
-
108
 |
 |
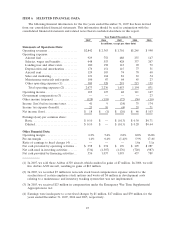
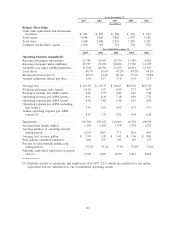
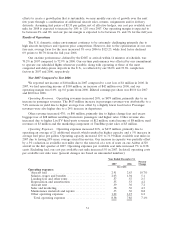
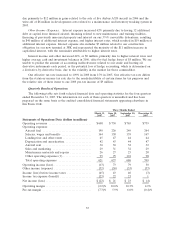
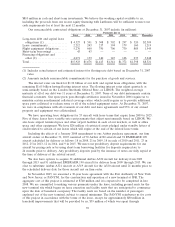
In 2007, our average stage length declined 5%to 1,129 miles due to increased operation of the
shorter-range EMBRAER 190 aircraft. A shorter average stage length results in fewer available seat
miles and, therefore, higher unit costs. We estimate that more than half of the year-over-year increase
in our total cost per available seat mile was attributable to the decrease in our average stage length
and also was a significant factor of the increase in each component.
Aircraft fuel expense increased 24%, or $177 million, due to 67 million more gallons of aircraft
fuel consumed resulting in $133 million of additional fuel expense and a 5%increase in average fuel
cost per gallon, or $44 million. Aircraft fuel prices remained at or near historically high levels in 2007,
with our average fuel price per gallon at $2.09 compared to $1.99 for the year ended December 31,
2006. Our fuel costs represented 35%and 34%of our operating expenses in 2007 and 2006,
respectively. Our fuel consumption per block hour decreased 3%due to utilization of the lighter
EMBRAER 190 aircraft and various fuel conservation initiatives. Cost per available seat mile
increased 11%primarily due higher fuel prices and increased stage length..
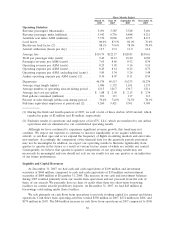
Salaries, wages and benefits increased 17%, or $95 million, due primarily to changes in our
employee retirement plan, increases in our 2007 pilot pay rates, increased profit sharing and overtime
pay resulting from the weather-related events in the first quarter of 2007. Specifically, we recorded
$20 million of profit sharing in 2007 compared to $3 million in 2006. Cost per available seat mile
increased 5%as a result of the 2007 pilot pay increases and profit sharing.
Landing fees and other rents increased 14%, or $22 million, due to a 24%increase in departures
over 2006 and increased airport rents associated with opening five new cities in 2007. Cost per
available seat mile increased 3%due to the decrease in average stage length.
Depreciation and amortization increased 16%, or $25 million, primarily due to having an average
of 78 owned and capital leased aircraft in 2007 compared to 67 in 2006.
Aircraft rent increased 20%, or $21 million, due to seven new EMBRAER 190 aircraft leases.
Cost per available seat mile increased 7%due to a higher percentage of our fleet being leased.
Sales and marketing expense increased 16%, or $17 million, primarily due to $11 million in higher
credit card fees resulting from increased passenger revenues and $5 million in commissions related to
our participation in GDSs. On a cost per available seat mile basis, sales and marketing expense
increased 4%primarily due to higher credit card fees and more GDS commissions. We book the
majority of our reservations through a combination of our website and our agents (76%and 16%in
2007, respectively).
Maintenance materials and repairs increased 21%, or $19 million, due to 21 more average
operating aircraft in 2007 compared to 2006 and a gradual aging of our fleet. Cost per available seat
mile increased 9%primarily due to an increase in the average age of our fleet. Maintenance expense is
expected to increase significantly as our fleet ages.
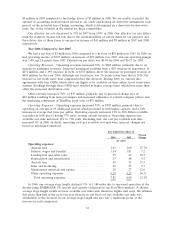
Other operating expenses increased 19%, or $61 million, primarily due to higher variable costs
associated with 12%increased capacity and a 15%increase in the number of passengers served.
$4 million of the increase is related to LiveTV’s development of in-flight data connectivity and
$5 million is attributable to higher interrupted trip expenses. In addition, other operating expenses
include $7 million and $12 million in gains on sales of aircraft in 2007 and 2006, respectively. Cost per
available seat mile increased 6%due primarily to fewer gains on the sale of aircraft.
Other Income (Expense). Interest expense increased 31%, or $52 million, primarily due to
increases of $34 million in interest associated with the debt or capital lease financing for new aircraft
deliveries, $13 million of interest for the financing of previously unsecured property and $18 million of
interest related to our construction obligation for our new terminal at JFK. Interest expense was
reduced by approximately $7 million due to the scheduled pay downs of our long-term debt
obligations and by an additional $6 million related to retired debt for sold aircraft. The increase in
capitalized interest was primarily attributable to the higher interest expense incurred for our new
terminal.
Interest income and other increased 96%, or $26 million, primarily due to a $17 million increase
in interest income due to higher average cash and investment balances and fuel hedge gains of
32