JetBlue Airlines 2007 Annual Report Download - page 41
Download and view the complete annual report
Please find page 41 of the 2007 JetBlue Airlines annual report below. You can navigate through the pages in the report by either clicking on the pages listed below, or by using the keyword search tool below to find specific information within the annual report.-
 1
1 -
2
-
3
-
4
-
5
-
6
-
7
-
8
-
9
-
10
-
11
-
12
-
13
-
14
-
15
-
16
-
17
-
18
-
19
-
20
-
21
-
22
-
23
-
24
-
25
-
26
-
27
-
28
-
29
-
30
-
 31
31 -
 32
32 -
 33
33 -
 34
34 -
 35
35 -
 36
36 -
 37
37 -
 38
38 -
 39
39 -
 40
40 -
 41
41 -
 42
42 -
 43
43 -
 44
44 -
 45
45 -
 46
46 -
 47
47 -
 48
48 -
 49
49 -
 50
50 -
 51
51 -
52
-
53
-
54
-
55
-
56
-
57
-
58
-
59
-
60
-
61
-
62
-
63
-
64
-
65
-
66
-
67
-
68
-
69
-
70
-
71
-
72
-
73
-
74
-
75
-
76
-
77
-
78
-
79
-
80
-
81
-
82
-
83
-
84
-
85
-
86
-
87
-
88
-
89
-
90
-
91
-
92
-
93
-
94
-
95
-
96
-
97
-
98
-
99
-
100
-
101
-
102
-
103
-
104
-
105
-
106
-
107
-
108
 |
 |

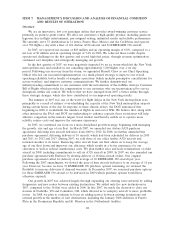
efforts to create a growth plan that is sustainable, we may modify our rate of growth over the next
few years through a combination of additional aircraft sales, returns, assignments and/or delivery
deferrals. Assuming fuel prices of $2.55 per gallon, net of effective hedges, our cost per available seat
mile for 2008 is expected to increase by 10%to 12%over 2007. Our operating margin is expected to
be between 6%and 8%and our pre-tax margin is expected to be between 1%and 3%for the full year.
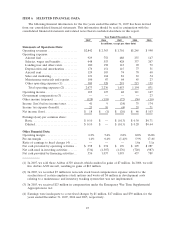
Results of Operations
The U.S. domestic airline environment continues to be extremely challenging primarily due to
high aircraft fuel prices and vigorous price competition. However, due to the optimization of our own
fare mix, average fares for the year increased 3%over 2006 to $123.23, while load factor declined
0.9 points to 80.7%from the full year 2006.
Our on-time performance, defined by the DOT as arrivals within 14 minutes of schedule, was
70.2%in 2007 compared to 72.9%in 2006. Our on-time performance was affected by our commitment
to operate our scheduled flights whenever possible, along with operating at three of the most
congested and delay-prone airports in the U.S., as reflected by our 98.0%and 99.6%completion
factors in 2007 and 2006, respectively.
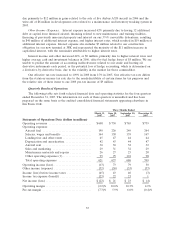
Year 2007 Compared to Year 2006
We reported net income of $18 million in 2007 compared to a net loss of $1 million in 2006. In
2007, we had operating income of $169 million, an increase of $42 million over 2006, and our
operating margin was 6.0%, up 0.6 points from 2006. Diluted earnings per share was $0.10 for 2007
and $0.00 for 2006.
Operating Revenues. Operating revenues increased 20%, or $479 million, primarily due to an
increase in passenger revenues. The $413 million increase in passenger revenues was attributable to a
7.4%increase in yield due to higher average fare offset by a slightly lower load factor. Passenger
revenues were also higher due to a 24%increase in departures.
Other revenue increased 47%, or $66 million, primarily due to higher change fees and excess
baggage fees of $28 million resulting from more passengers and higher rates. Other revenue also
increased due to higher LiveTV third-party revenues of $12 million, rental income of $8 million, mail
revenues of $3 million and the marketing component of TrueBlue point sales of $3 million.
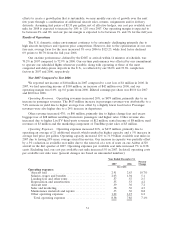
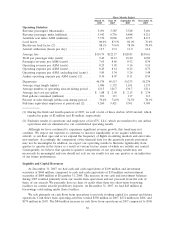
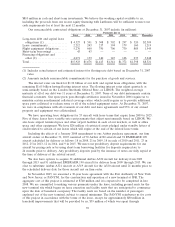
Operating Expenses. Operating expenses increased 20%, or $437 million, primarily due to
operating an average of 21 additional aircraft, which resulted in higher capacity, and a 5%increase in
average fuel price per gallon. Operating capacity increased 12%to 31.9 billion available seat miles in
2007 due to having 20%more average aircraft in-service. Our increase in capacity was partially offset
bya3%reduction in available seat miles due to the removal of a row of seats on our Airbus A320
aircraft in the first quarter of 2007. Operating expenses per available seat mile increased 7%to 8.38
cents. Excluding fuel, our cost per available seat mile increased 5%in 2007. In detail, operating costs
per available seat mile were (percent changes are based on unrounded numbers):
Year Ended December 31,
2007 2006
Percent
Change
(in cents)
Operating expenses:
Aircraft fuel ........................................ 2.91 2.63 10.7%
Salaries, wages and benefits ........................... 2.03 1.94 5.1
Landing fees and other rents .......................... .57 .55 2.5
Depreciation and amortization ........................ .55 .53 4.2
Aircraft rent ........................................ .39 .36 7.2
Sales and marketing ................................. .38 .36 4.3
Maintenance materials and repairs ..................... .33 .30 8.8
Other operating expenses ............................ 1.22 1.15 6.2
Total operating expenses ........................... 8.38 7.82 7.1%
31