JetBlue Airlines 2007 Annual Report Download - page 36
Download and view the complete annual report
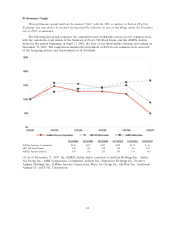
Please find page 36 of the 2007 JetBlue Airlines annual report below. You can navigate through the pages in the report by either clicking on the pages listed below, or by using the keyword search tool below to find specific information within the annual report.-
 1
1 -
2
-
3
-
4
-
5
-
6
-
7
-
8
-
9
-
10
-
11
-
12
-
13
-
14
-
15
-
16
-
17
-
18
-
19
-
20
-
21
-
22
-
23
-
24
-
25
-
 26
26 -
 27
27 -
 28
28 -
 29
29 -
 30
30 -
 31
31 -
 32
32 -
 33
33 -
 34
34 -
 35
35 -
 36
36 -
 37
37 -
 38
38 -
 39
39 -
 40
40 -
 41
41 -
 42
42 -
 43
43 -
 44
44 -
 45
45 -
 46
46 -
47
-
48
-
49
-
50
-
51
-
52
-
53
-
54
-
55
-
56
-
57
-
58
-
59
-
60
-
61
-
62
-
63
-
64
-
65
-
66
-
67
-
68
-
69
-
70
-
71
-
72
-
73
-
74
-
75
-
76
-
77
-
78
-
79
-
80
-
81
-
82
-
83
-
84
-
85
-
86
-
87
-
88
-
89
-
90
-
91
-
92
-
93
-
94
-
95
-
96
-
97
-
98
-
99
-
100
-
101
-
102
-
103
-
104
-
105
-
106
-
107
-
108
 |
 |

As of December 31,
2007 2006 2005 2004 2003
(in millions)
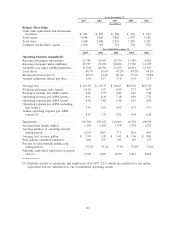
Balance Sheet Data:
Cash, cash equivalents and investment
securities .......................... $ 834 $ 699 $ 484 $ 450 $ 607
Total assets.......................... 5,598 4,843 3,892 2,797 2,185
Total debt ........................... 3,048 2,840 2,326 1,545 1,109
Common stockholders’ equity.......... 1,036 952 911 754 670
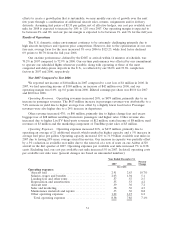
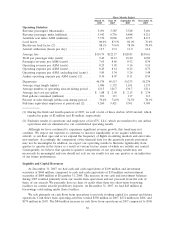
Year Ended December 31,
2007 2006 2005 2004 2003
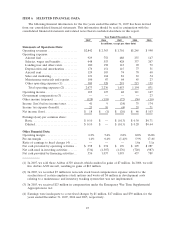
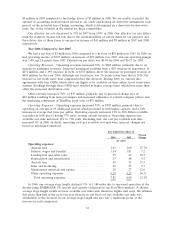
Operating Statistics (unaudited):
Revenue passengers (thousands) ......... 21,387 18,565 14,729 11,783 9,012
Revenue passenger miles (millions) ...... 25,737 23,320 20,200 15,730 11,527
Available seat miles (ASMs)(millions).... 31,904 28,594 23,703 18,911 13,639
Load factor ........................... 80.7%81.6%85.2%83.2%84.5%
Breakeven load factor (5)............... 80.7%81.4%86.1%77.9%72.6%
Aircraft utilization (hours per day)....... 12.8 12.7 13.4 13.4 13.0
Average fare .......................... $ 123.23 $ 119.73 $ 110.03 $103.49 $107.09
Yield per passenger mile (cents) ......... 10.24 9.53 8.02 7.75 8.37
Passenger revenue per ASM (cents)...... 8.26 7.77 6.84 6.45 7.08
Operating revenue per ASM (cents) ..... 8.91 8.26 7.18 6.69 7.32
Operating expense per ASM (cents) ..... 8.38 7.82 6.98 6.10 6.09
Operating expense per ASM, excluding
fuel (cents).......................... 5.47 5.19 4.92 4.75 5.01
Airline operating expense per ASM
(cents) (5) .......................... 8.27 7.76 6.91 6.04 6.08
Departures............................ 196,594 159,152 112,009 90,532 66,920
Average stage length (miles) ............ 1,129 1,186 1,358 1,339 1,272
Average number of operating aircraft
during period........................ 127.8 106.5 77.5 60.6 44.0
Average fuel cost per gallon ............ $ 2.09 1.99 $ 1.61 $ 1.06 $ 0.85
Fuel gallons consumed (millions) ........ 444 377 303 241 173
Percent of sales through jetblue.com
during period........................ 75.7%79.1%77.5%75.4%73.0%
Full-time equivalent employees at period
end(5)............................. 9,909 9,265 8,326 6,413 4,892
(5) Excludes results of operations and employees of LiveTV, LLC, which are unrelated to our airline
operations and are immaterial to our consolidated operating results.
26