JetBlue Airlines 2007 Annual Report Download - page 43
Download and view the complete annual report
Please find page 43 of the 2007 JetBlue Airlines annual report below. You can navigate through the pages in the report by either clicking on the pages listed below, or by using the keyword search tool below to find specific information within the annual report.-
 1
1 -
2
-
3
-
4
-
5
-
6
-
7
-
8
-
9
-
10
-
11
-
12
-
13
-
14
-
15
-
16
-
17
-
18
-
19
-
20
-
21
-
22
-
23
-
24
-
25
-
26
-
27
-
28
-
29
-
30
-
31
-
32
-
 33
33 -
 34
34 -
 35
35 -
 36
36 -
 37
37 -
 38
38 -
 39
39 -
 40
40 -
 41
41 -
 42
42 -
 43
43 -
 44
44 -
 45
45 -
 46
46 -
 47
47 -
 48
48 -
 49
49 -
 50
50 -
 51
51 -
 52
52 -
 53
53 -
54
-
55
-
56
-
57
-
58
-
59
-
60
-
61
-
62
-
63
-
64
-
65
-
66
-
67
-
68
-
69
-
70
-
71
-
72
-
73
-
74
-
75
-
76
-
77
-
78
-
79
-
80
-
81
-
82
-
83
-
84
-
85
-
86
-
87
-
88
-
89
-
90
-
91
-
92
-
93
-
94
-
95
-
96
-
97
-
98
-
99
-
100
-
101
-
102
-
103
-
104
-
105
-
106
-
107
-
108
 |
 |

$5 million in 2007 compared to fuel hedge losses of $5 million in 2006. We are unable to predict the
amount of accounting ineffectiveness related to our crude and heating oil derivative instruments each
period, or the potential loss of hedge accounting, which is determined on a derivative-by-derivative
basis, due to the volatility in the market for these commodities.
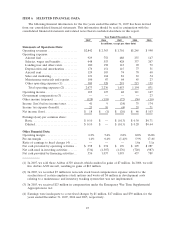
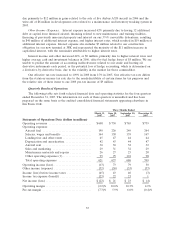
Our effective tax rate decreased to 55%in 2007 from 109%in 2006. Our effective tax rate differs
from the statutory income tax rate due to the nondeductibility of certain items for tax purposes and
the relative size of these items to our pre-tax income of $41 million and $9 million in 2007 and 2006,
respectively.
Year 2006 Compared to Year 2005
We had a net loss of $1 million in 2006 compared to a net loss of $20 million in 2005. In 2006, we
had operating income of $127 million, an increase of $79 million over 2005, and our operating margin
was 5.4%, up 2.6 points from 2005. Diluted loss per share was $0.00 for 2006 and $0.13 for 2005.
Operating Revenues. Operating revenues increased 39%, or $662 million, primarily due to an
increase in passenger revenues. Increased passengers resulting from a 42%increase in departures, or
$251 million, and a 19%increase in yield, or $352 million, drove the increase in passenger revenue of
$603 million for the year 2006. Although our load factor was 3.6 points lower than that of 2005, the
increase in our yields more than compensated for this decrease. During 2006, we entered into
agreements with four GDSs, which allow our flights to be available on their online travel reservation
systems. Bookings through these GDSs have resulted in higher average fares, which have more than
offset the increased distribution costs.
Other revenue increased 74%, or $59 million, primarily due to increased change fees of
$22 million resulting from more passengers and increased adherence to related company polices and
the marketing component of TrueBlue point sales of $11 million.
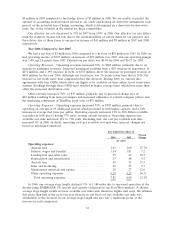
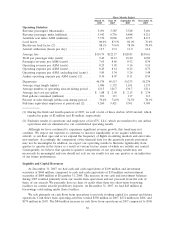
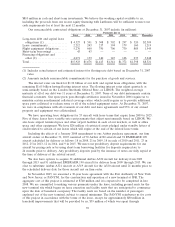
Operating Expenses. Operating expenses increased 35%, or $583 million, primarily due to
operating an average of 29 additional aircraft, which provided us with higher capacity, and a 24%
increase in average fuel price per gallon. Operating capacity increased 21%to 28.6 billion available
seat miles in 2006 due to having 37%more average aircraft in-service. Operating expenses per
available seat mile increased 12%to 7.82 cents. Excluding fuel, our cost per available seat mile
increased 6%in 2006. In detail, operating costs per available seat mile were (percent changes are
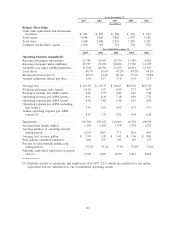
based on unrounded numbers):
Year Ended December 31,
2006 2005
Percent
Change
(in cents)
Operating expenses:
Aircraft fuel ........................................ 2.63 2.06 27.7%
Salaries, wages and benefits .......................... 1.94 1.81 7.2
Landing fees and other rents ......................... .55 .47 16.5
Depreciation and amortization ....................... .53 .48 9.2
Aircraft rent........................................ .36 .31 15.2
Sales and marketing ................................. .36 .35 5.3
Maintenance materials and repairs .................... .30 .27 12.6
Other operating expenses ............................ 1.15 1.23 (6.5)
Total operating expenses ........................... 7.82 6.98 12.1%
In 2006, our average stage length declined 13%to 1,186 miles due to increased operation of the
shorter-range EMBRAER 190 aircraft and capacity reductions in our East-West markets. A shorter
average stage length results in fewer available seat miles and, therefore, higher unit costs. We estimate
that more than half of the year-over-year increase in our total cost per available seat mile was
attributable to the decrease in our average stage length and also was a significant factor of the
increase in each component.
33