JetBlue Airlines 2007 Annual Report Download - page 45
Download and view the complete annual report
Please find page 45 of the 2007 JetBlue Airlines annual report below. You can navigate through the pages in the report by either clicking on the pages listed below, or by using the keyword search tool below to find specific information within the annual report.-
 1
1 -
2
-
3
-
4
-
5
-
6
-
7
-
8
-
9
-
10
-
11
-
12
-
13
-
14
-
15
-
16
-
17
-
18
-
19
-
20
-
21
-
22
-
23
-
24
-
25
-
26
-
27
-
28
-
29
-
30
-
31
-
32
-
33
-
34
-
 35
35 -
 36
36 -
 37
37 -
 38
38 -
 39
39 -
 40
40 -
 41
41 -
 42
42 -
 43
43 -
 44
44 -
 45
45 -
 46
46 -
 47
47 -
 48
48 -
 49
49 -
 50
50 -
 51
51 -
 52
52 -
 53
53 -
 54
54 -
 55
55 -
56
-
57
-
58
-
59
-
60
-
61
-
62
-
63
-
64
-
65
-
66
-
67
-
68
-
69
-
70
-
71
-
72
-
73
-
74
-
75
-
76
-
77
-
78
-
79
-
80
-
81
-
82
-
83
-
84
-
85
-
86
-
87
-
88
-
89
-
90
-
91
-
92
-
93
-
94
-
95
-
96
-
97
-
98
-
99
-
100
-
101
-
102
-
103
-
104
-
105
-
106
-
107
-
108
 |
 |

due primarily to $12 million in gains related to the sale of five Airbus A320 aircraft in 2006 and the
write-off of $6 million in development costs related to a maintenance and inventory tracking system in
2005.
Other Income (Expense). Interest expense increased 62%primarily due to having 12 additional
debt or capital lease financed aircraft, financing related to new maintenance and training facilities,
financing of previously unsecured property and interest on our 3
3
⁄
4
%convertible debentures, resulting
in $40 million of additional interest expense, and higher interest rates, which resulted in $19 million of
additional interest expense. Interest expense also includes $7 million related to our construction
obligation for our new terminal at JFK and represented the majority of the $11 million increase in
capitalized interest, with the remainder attributable to higher interest rates.
Interest income and other increased 44%, or $9 million, primarily due to higher interest rates and
higher average cash and investment balances in 2006, offset by fuel hedge losses of $5 million. We are
unable to predict the amount of accounting ineffectiveness related to our crude and heating oil
derivative instruments each period, or the potential loss of hedge accounting, which is determined on
a derivative-by-derivative basis, due to the volatility in the market for these commodities.
Our effective tax rate increased to 109%in 2006 from 15%in 2005. Our effective tax rate differs
from the statutory income tax rate due to the nondeductibility of certain items for tax purposes and
the relative size of these items to our 2006 pre-tax income of $9 million.
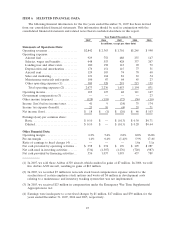
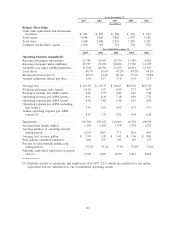
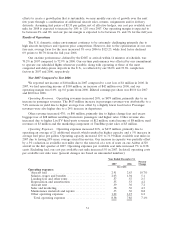
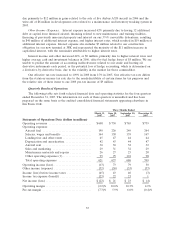
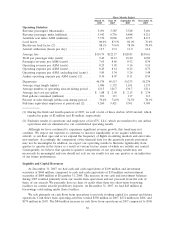
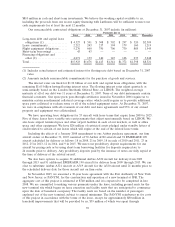
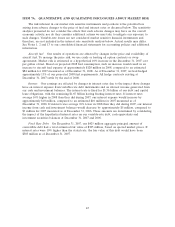
Quarterly Results of Operations
The following table sets forth selected financial data and operating statistics for the four quarters
ended December 31, 2007. The information for each of these quarters is unaudited and has been
prepared on the same basis as the audited consolidated financial statements appearing elsewhere in
this Form 10-K.
Three Months Ended
March 31,
2007
June 30,
2007
September 30,
2007
December 31,
2007
Statements of Operations Data (dollars in millions)
Operating revenues .............................. $608 $730 $765 $739
Operating expenses:
Aircraft fuel .................................. 190 226 249 264
Salaries, wages and benefits ..................... 164 158 159 167
Landing fees and other rents .................... 45 47 44 44
Depreciation and amortization ................... 42 43 44 47
Aircraft rent .................................. 30 30 32 32
Sales and marketing ........................... 29 31 32 29
Maintenance materials and repairs ............... 26 27 25 28
Other operating expenses (1) .................... 95 95 101 98
Total operating expenses ....................... 621 657 686 709
Operating income (loss)........................... (13) 73 79 30
Other income (expense) .......................... (32) (30) (33) (33)
Income (loss) before income taxes ................. (45) 43 46 (3)
Income tax expense (benefit) ...................... (23) 22 23 1
Net income (loss) ................................ $(22) $ 21 $ 23 $ (4)
Operating margin ................................ (2.2)%10.0%10.3%4.1%
Pre-tax margin ................................... (7.3)%5.9%6.0%(0.4)%
35