JetBlue Airlines 2007 Annual Report Download - page 40
Download and view the complete annual report
Please find page 40 of the 2007 JetBlue Airlines annual report below. You can navigate through the pages in the report by either clicking on the pages listed below, or by using the keyword search tool below to find specific information within the annual report.-
 1
1 -
2
-
3
-
4
-
5
-
6
-
7
-
8
-
9
-
10
-
11
-
12
-
13
-
14
-
15
-
16
-
17
-
18
-
19
-
20
-
21
-
22
-
23
-
24
-
25
-
26
-
27
-
28
-
29
-
 30
30 -
 31
31 -
 32
32 -
 33
33 -
 34
34 -
 35
35 -
 36
36 -
 37
37 -
 38
38 -
 39
39 -
 40
40 -
 41
41 -
 42
42 -
 43
43 -
 44
44 -
 45
45 -
 46
46 -
 47
47 -
 48
48 -
 49
49 -
 50
50 -
51
-
52
-
53
-
54
-
55
-
56
-
57
-
58
-
59
-
60
-
61
-
62
-
63
-
64
-
65
-
66
-
67
-
68
-
69
-
70
-
71
-
72
-
73
-
74
-
75
-
76
-
77
-
78
-
79
-
80
-
81
-
82
-
83
-
84
-
85
-
86
-
87
-
88
-
89
-
90
-
91
-
92
-
93
-
94
-
95
-
96
-
97
-
98
-
99
-
100
-
101
-
102
-
103
-
104
-
105
-
106
-
107
-
108
 |
 |
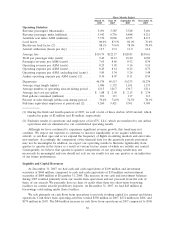
economic and geopolitical factors that we can neither control nor accurately predict. Sales and
marketing expenses include advertising and fees paid to credit card companies. Our distribution costs
tend to be lower than those of most other airlines on a per unit basis because the majority of our
customers book directly through our website or our agents. Maintenance materials and repairs are
expensed when incurred unless covered by a third party services contract. Because the average age of
our aircraft is 3.1 years, all of our aircraft require less maintenance now than they will in the future.
Our maintenance costs will increase significantly, both on an absolute basis and as a percentage of our
unit costs, as our fleet ages. Other operating expenses consist of purchased services (including
expenses related to fueling, ground handling, skycap, security and janitorial services), insurance,
personnel expenses, cost of goods sold to other airlines by LiveTV, professional fees, passenger
refreshments, supplies, bad debts, communication costs, gains on aircraft sales and taxes other than
payroll taxes, including fuel taxes.
The airline industry is one of the most heavily taxed in the U.S., with taxes and fees accounting
for approximately 14%of the total fare charged to a customer. Airlines are obligated to fund all of
these taxes and fees regardless of their ability to pass these charges on to the customer. Additionally,
if the TSA changes the way the Aviation Security Infrastructure Fee is assessed, our security costs
may be higher.
The airline industry has been intensely competitive in recent years, due in part to persistently
high fuel prices and the adverse financial condition of many of the domestic airlines. In 2005
US Airways and America West merged, and each of Delta Air Lines and Northwest Airlines filed for
bankruptcy protection. Both Delta and Northwest emerged from bankruptcy in 2007 with lower costs,
which is allowing them to compete more vigorously. Through 2007 and into 2008, there have been
other reports of potential consolidation within the industry. We are unable to predict what the effect
of further industry consolidation would be for us or for the airline industry in general. In 2007, most
traditional network airlines continued to increase capacity on their international routes and only
slightly increased their domestic capacity. These developments, in conjunction with our shift of
capacity from some transcontinental flights to more short- and medium-haul routes, contributed to our
improved financial performance in 2007.
Our ability to be profitable in this competitive environment depends on, among other things,
operating at costs equal to or lower than those of our competitors, continuing to provide high quality
customer service and maintaining adequate liquidity levels. Although we have been able to raise
capital and continue to grow, the highly competitive nature of the airline industry could prevent us
from attaining the passenger traffic or yields required to be profitable in new and existing markets.
The highest levels of traffic and revenue on our routes to and from Florida are generally realized
from October through April, and on our routes to and from the western United States in the summer.
Many of our areas of operations in the Northeast experience bad weather conditions in the winter,
causing increased costs associated with deicing aircraft, cancelled flights and accommodating displaced
passengers. Our Florida and Caribbean routes experience bad weather conditions in the summer and
fall due to thunderstorms and hurricanes. As we enter new markets, we could be subject to additional
seasonal variations along with competitive responses to our entry by other airlines. Given our high
proportion of fixed costs, this seasonality may cause our results of operations to vary from quarter to
quarter.
Outlook for 2008
Our focus in 2008 will continue to be on disciplined growth, rigorous cost control and revenue
optimization. We expect the year-over-year upward trend in yield and RASM to continue through
2008 as a result of our overall decreased domestic capacity and maturity of our markets. In addition,
we are continuously looking to expand our other revenue opportunities, including charter services,
marketing alliances, and through our 2008 introduction of refundable fares.
We expect our full-year operating capacity for 2008 to increase approximately 5%to 8%over
2007 with the addition of 12 new Airbus A320 aircraft and six new EMBRAER 190 aircraft to our
operating fleet, offset by the planned sale of six of our Airbus A320 aircraft during the year. In our
30