JetBlue Airlines 2007 Annual Report Download - page 35
Download and view the complete annual report
Please find page 35 of the 2007 JetBlue Airlines annual report below. You can navigate through the pages in the report by either clicking on the pages listed below, or by using the keyword search tool below to find specific information within the annual report.-
 1
1 -
2
-
3
-
4
-
5
-
6
-
7
-
8
-
9
-
10
-
11
-
12
-
13
-
14
-
15
-
16
-
17
-
18
-
19
-
20
-
21
-
22
-
23
-
24
-
 25
25 -
 26
26 -
 27
27 -
 28
28 -
 29
29 -
 30
30 -
 31
31 -
 32
32 -
 33
33 -
 34
34 -
 35
35 -
 36
36 -
 37
37 -
 38
38 -
 39
39 -
 40
40 -
 41
41 -
 42
42 -
 43
43 -
 44
44 -
 45
45 -
46
-
47
-
48
-
49
-
50
-
51
-
52
-
53
-
54
-
55
-
56
-
57
-
58
-
59
-
60
-
61
-
62
-
63
-
64
-
65
-
66
-
67
-
68
-
69
-
70
-
71
-
72
-
73
-
74
-
75
-
76
-
77
-
78
-
79
-
80
-
81
-
82
-
83
-
84
-
85
-
86
-
87
-
88
-
89
-
90
-
91
-
92
-
93
-
94
-
95
-
96
-
97
-
98
-
99
-
100
-
101
-
102
-
103
-
104
-
105
-
106
-
107
-
108
 |
 |

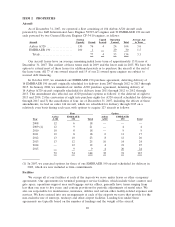
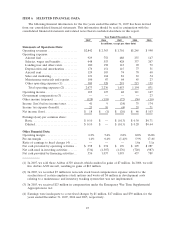
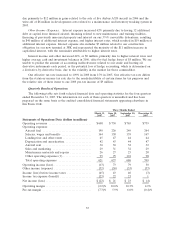
ITEM 6. SELECTED FINANCIAL DATA
The following financial information for the five years ended December 31, 2007 has been derived
from our consolidated financial statements. This information should be read in conjunction with the
consolidated financial statements and related notes thereto included elsewhere in this report.
Year Ended December 31,
2007 2006 2005 2004 2003
(in millions, except per share data)
Statements of Operations Data:
Operating revenues ..................... $2,842 $ 2,363 $ 1,701 $1,265 $ 998
Operating expenses:
Aircraft fuel ......................... 929 752 488 255 147
Salaries, wages and benefits ............ 648 553 428 337 267
Landing fees and other rents ........... 180 158 112 92 70
Depreciation and amortization ......... 176 151 115 77 51
Aircraft rent ......................... 124 103 74 70 60
Sales and marketing................... 121 104 81 63 54
Maintenance materials and repairs ...... 106 87 64 45 23
Other operating expenses (1)........... 389 328 291 215 159
Total operating expenses (2) ......... 2,673 2,236 1,653 1,154 831
Operating income....................... 169 127 48 111 167
Government compensation (3) ........... — — — — 23
Other income (expense) ................. (128) (118) (72) (36) (16)
Income (loss) before income taxes ........ 41 9 (24) 75 174
Income tax expense (benefit)............. 23 10 (4) 29 71
Net income (loss)....................... $ 18 $ (1) $ (20) $ 46 $ 103
Earnings (loss) per common share:
Basic................................ $ 0.10 $ — $ (0.13) $ 0.30 $ 0.71
Diluted.............................. $ 0.10 $ — $ (0.13) $ 0.28 $ 0.64
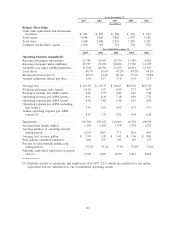
Other Financial Data:
Operating margin....................... 6.0%5.4%2.8%8.8%16.8%
Pre-tax margin ......................... 1.4%0.4%(1.4)%5.9%17.4%
Ratio of earnings to fixed charges (4) ..... — — — 1.6x 3.1x
Net cash provided by operating activities . . $ 358 $ 274 $ 170 $ 199 $ 287
Net cash used in investing activities ....... (734) (1,307) (1,276) (720) (987)
Net cash provided by financing activities. . . 556 1,037 1,093 437 789
(1) In 2007, we sold three Airbus A320 aircraft, which resulted in gains of $7 million. In 2006, we sold
five Airbus A320 aircraft, resulting in gains of $12 million.
(2) In 2005, we recorded $7 million in non-cash stock-based compensation expense related to the
acceleration of certain employee stock options and wrote-off $6 million in development costs
relating to a maintenance and inventory tracking system that was not implemented.
(3) In 2003, we received $23 million in compensation under the Emergency War Time Supplemental
Appropriations Act.
(4) Earnings were inadequate to cover fixed charges by $1 million, $17 million and $39 million for the
years ended December 31, 2007, 2006 and 2005, respectively.
25