Honda 2009 Annual Report Download - page 9
Download and view the complete annual report
Please find page 9 of the 2009 Honda annual report below. You can navigate through the pages in the report by either clicking on the pages listed below, or by using the keyword search tool below to find specific information within the annual report.-
 1
1 -
 2
2 -
 3
3 -
 4
4 -
 5
5 -
 6
6 -
 7
7 -
 8
8 -
 9
9 -
 10
10 -
 11
11 -
 12
12 -
 13
13 -
 14
14 -
 15
15 -
 16
16 -
 17
17 -
 18
18 -
 19
19 -
 20
20 -
21
-
22
-
23
-
24
-
25
-
26
-
27
-
28
-
29
-
30
-
31
-
32
-
33
-
34
-
35
-
36
-
37
-
38
-
39
-
40
-
41
-
42
-
43
-
44
-
45
-
46
-
47
-
48
-
49
-
50
-
51
-
52
-
53
-
54
-
55
-
56
-
57
-
58
-
59
-
60
-
61
-
62
-
63
-
64
-
65
-
66
-
67
-
68
-
69
-
70
-
71
-
72
-
73
-
74
-
75
-
76
-
77
-
78
-
79
-
80
-
81
-
82
-
83
-
84
-
85
-
86
-
87
-
88
-
89
-
90
-
91
-
92
 |
 |

12,000
10,000
8,000
6,000
4,000
2,000
0
2,000
1,500
1,000
500
0
05 06 07 08 09 05 06 07 08 09 05 06 07 08 09
05 06 07 08 09 05 06 07 08 09 05 06 07 08 09 05 06 07 08 09
10,000
8,000
6,000
4,000
2,000
0
600
500
400
300
200
100
0
500
400
300
200
100
0
4,000
3,000
2,000
1,000
0
8,000
6,000
4,000
2,000
0
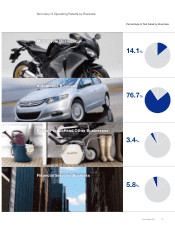
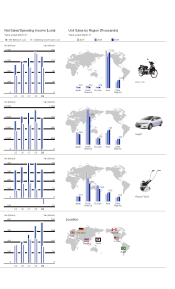
Unit Sales
Motorcycles
Automobile Business Financial Services Business Power Product and Other Businesses
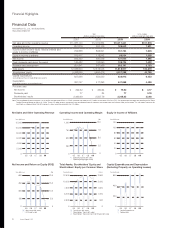
Net Sales
Motorcycle Business
(Thousands) (Thousands) (Thousands)
Automobiles Power Products
Japan North America Europe Asia Other Regions
Japan North America Europe Asia Other Regions
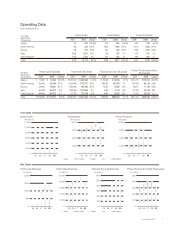
Operating Data
Years ended March 31
Unit Sales
Breakdown
(Thousands)
Motorcycles Automobiles Power Products
2008 2009 Change 2008 2009 Change 2008 2009 Change
Japan 311 232 (25.4)%615 556 (9.6)%550 516 (6.2)%
North America 453 320 (29.4) 1,850 1,496 (19.1) 2,415 1,893 (21.6)
Europe 313 276 (11.8) 391 350 (10.5) 1,693 1,306 (22.9)
Asia 6,633 7,523 13.4 755 793 5.0 915 970 6.0
Other Regions 1,610 1,763 9.5 314 322 2.5 484 502 3.7
Total 9,320 10,114 8.5 %3,925 3,517 (10.4)%6,057 5,187 (14.4)%
Net Sales
Breakdown
Yen (millions)
Motorcycle Business Automobile Business Financial Services Business Power Product and Other
Businesses
2008 2009 Change 2008 2009 Change 2008 2009 Change 2008 2009 Change
Japan ¥ 93,592 ¥ 81,822 (12.6)%¥1,321,005 ¥1,225,384 (7.2)%¥ 23,405 ¥ 24,083 2.9 %¥147,775 ¥115,252 (22.0)%
North America 265,609 182,284 (31.4) 5,209,446 3,723,877 (28.5) 483,925 527,905 9.1 109,445 80,124 (26.8)
Europe 226,687 178,621 (21.2) 1,182,666 923,580 (21.9) 13,234 12,685 (4.1) 96,847 71,126 (26.6)
Asia 484,418 460,412 (5.0) 1,048,463 1,079,585 3.0 4,936 4,736 (4.1) 39,449 50,739 28.6
Other Regions 488,390 508,372 4.1 727,811 721,978 (0.8) 8,053 12,852 59.6 27,678 25,824 (6.7)
Total ¥1,558,696 ¥1,411,511 (9.4)%¥9,489,391 ¥7,674,404 (19.1)%¥533,553 ¥582,261 9.1 %¥421,194 ¥343,065 (18.5)%
Annual Report 2009 7