Honda 2009 Annual Report Download - page 77
Download and view the complete annual report
Please find page 77 of the 2009 Honda annual report below. You can navigate through the pages in the report by either clicking on the pages listed below, or by using the keyword search tool below to find specific information within the annual report.-
 1
1 -
2
-
3
-
4
-
5
-
6
-
7
-
8
-
9
-
10
-
11
-
12
-
13
-
14
-
15
-
16
-
17
-
18
-
19
-
20
-
21
-
22
-
23
-
24
-
25
-
26
-
27
-
28
-
29
-
30
-
31
-
32
-
33
-
34
-
35
-
36
-
37
-
38
-
39
-
40
-
41
-
42
-
43
-
44
-
45
-
46
-
47
-
48
-
49
-
50
-
51
-
52
-
53
-
54
-
55
-
56
-
57
-
58
-
59
-
60
-
61
-
62
-
63
-
64
-
65
-
66
-
 67
67 -
 68
68 -
 69
69 -
 70
70 -
 71
71 -
 72
72 -
 73
73 -
 74
74 -
 75
75 -
 76
76 -
 77
77 -
 78
78 -
 79
79 -
 80
80 -
 81
81 -
 82
82 -
 83
83 -
 84
84 -
 85
85 -
 86
86 -
 87
87 -
88
-
89
-
90
-
91
-
92
 |
 |

As of and for the year ended March 31, 2009
U.S dollars (millions)
Japan
North
America Europe Asia
Other
Regions Total
Reconciling
Items Consolidated
Net sales and other
operating revenue:
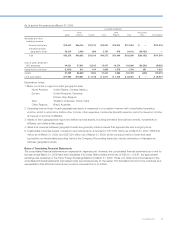
External customers $19,057 $46,164 $12,130 $13,591 $10,974 $101,916 $ — $101,916
Transfers between
geographic areas 23,319 2,488 889 2,781 675 30,152 (30,152) —
Total $42,376 $48,652 $13,019 $16,372 $11,649 $132,068 $(30,152) $101,916
Cost of sales, SG&A and
R&D expenses 44,021 47,841 12,915 15,317 10,274 130,368 (30,383) 99,985
Operating income (loss) (1,645) 811 104 1,055 1,375 1,700 231 1,931
Assets 31,339 66,659 7,804 10,344 4,582 120,728 (409) 120,319
Long-lived assets $11,609 $19,531 $ 1,125 $ 2,577 $ 1,215 $ 36,057 $ — $ 36,057
Explanatory notes:
1. Major countries or regions in each geographic area:
North America United States, Canada, Mexico
Europe United Kingdom, Germany,
France, Italy, Belgium
Asia Thailand, Indonesia, China, India
Other Regions Brazil, Australia
2. Operating income (loss) of each geographical region is measured in a consistent manner with consolidated operating
income, which is net income before other income, other expenses, income tax (benefi t) expense, minority interest in income,
and equity in income of affi liates.
3. Assets of each geographical region are defi ned as total assets, including derivative fi nancial instruments, investments in
affi liates, and deferred tax assets.
4. Sales and revenues between geographic areas are generally made at values that approximate arm’s-length prices.
5. Unallocated corporate assets, included in reconciling items, amounted to ¥377,873 million as of March 31, 2007, ¥385,442
million as of March 31, 2008, and ¥257,291 million as of March 31, 2009, which consist primarily of cash and cash
equivalents and marketable securities held by the Company. Reconciling items also include elimination of transactions
between geographic areas.
Basis of Translating Financial Statements
The consolidated fi nancial statements are expressed in Japanese yen. However, the consolidated fi nancial statements as of and for
the year ended March 31, 2009 have been translated into United States dollars at the rate of ¥98.23 = U.S.$1, the approximate
exchange rate prevailing on the Tokyo Foreign Exchange Market on March 31, 2009. Those U.S. dollar amounts presented in the
consolidated fi nancial statements and related notes are included solely for the reader. This translation should not be construed as a
representation that all the amounts shown could be converted into U.S. dollars.
Annual Report 2009 75