Honda 2009 Annual Report Download - page 73
Download and view the complete annual report
Please find page 73 of the 2009 Honda annual report below. You can navigate through the pages in the report by either clicking on the pages listed below, or by using the keyword search tool below to find specific information within the annual report.-
 1
1 -
2
-
3
-
4
-
5
-
6
-
7
-
8
-
9
-
10
-
11
-
12
-
13
-
14
-
15
-
16
-
17
-
18
-
19
-
20
-
21
-
22
-
23
-
24
-
25
-
26
-
27
-
28
-
29
-
30
-
31
-
32
-
33
-
34
-
35
-
36
-
37
-
38
-
39
-
40
-
41
-
42
-
43
-
44
-
45
-
46
-
47
-
48
-
49
-
50
-
51
-
52
-
53
-
54
-
55
-
56
-
57
-
58
-
59
-
60
-
61
-
62
-
 63
63 -
 64
64 -
 65
65 -
 66
66 -
 67
67 -
 68
68 -
 69
69 -
 70
70 -
 71
71 -
 72
72 -
 73
73 -
 74
74 -
 75
75 -
 76
76 -
 77
77 -
 78
78 -
 79
79 -
 80
80 -
 81
81 -
 82
82 -
 83
83 -
84
-
85
-
86
-
87
-
88
-
89
-
90
-
91
-
92
 |
 |

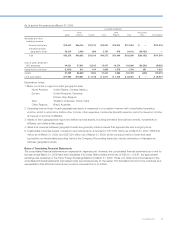
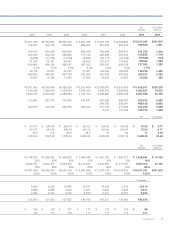
As of and for the year ended March 31, 2008
Yen (millions)
Motorcycle
Business
Automobile
Business
Financial
Services
Business
Power Product
and Other
Businesses
Segment
Total
Reconciling
Items Consolidated
Net sales and other operating revenue:
External customers ¥1,558,696 ¥ 9,489,391 ¥ 533,553 ¥ 421,194 ¥12,002,834 ¥ — ¥12,002,834
Intersegment — — 15,499 21,571 37,070 (37,070) —
Total 1,558,696 9,489,391 549,052 442,765 12,039,904 (37,070) 12,002,834
Cost of sales, SG&A and R&D expenses 1,407,409 8,827,726 431,254 420,406 11,086,795 (37,070) 11,049,725
Segment income 151,287 661,665 117,798 22,359 953,109 — 953,109
Equity in income of affi liates 28,035 89,521 — 1,386 118,942 — 118,942
Assets 1,240,527 5,591,311 5,907,839 330,604 13,070,281 (454,738) 12,615,543
Investments in affi liates 118,219 411,001 — 16,976 546,196 — 546,196
Depreciation and amortization 48,000 356,003 101,987 12,435 518,425 — 518,425
Capital expenditures 86,687 544,922 839,888 21,794 1,493,291 — 1,493,291
Impairment loss on long-lived assets and goodwill — — 5,850 — 5,850 — 5,850
Provision for credit and lease residual losses
on fi nance subsidiaries—receivables ¥ — ¥ — ¥ 58,011 ¥ — ¥ 58,011 ¥ — ¥ 58,011
As of and for the year ended March 31, 2009
Yen (millions)
Motorcycle
Business
Automobile
Business
Financial
Services
Business
Power Product
and Other
Businesses
Segment
Total
Reconciling
Items Consolidated
Net sales and other operating revenue:
External customers ¥1,411,511 ¥7,674,404 ¥ 582,261 ¥343,065 ¥10,011,241 ¥ — ¥10,011,241
Intersegment — — 14,264 25,840 40,104 (40,104) —
Total 1,411,511 7,674,404 596,525 368,905 10,051,345 (40,104) 10,011,241
Cost of sales, SG&A and R&D expenses 1,311,598 7,649,861 515,854 384,389 9,861,702 (40,104) 9,821,598
Segment income (loss) 99,913 24,543 80,671 (15,484) 189,643 — 189,643
Equity in income of affi liates 26,105 71,709 — 1,220 99,034 — 99,034
Assets 1,047,112 5,219,408 5,735,716 275,607 12,277,843 (458,926) 11,818,917
Investments in affi liates 107,431 379,068 — 16,247 502,746 — 502,746
Depreciation and amortization 51,200 373,295 199,324 13,825 637,644 — 637,644
Capital expenditures 90,401 523,593 671,127 16,920 1,302,041 — 1,302,041
Impairment loss on long-lived assets and goodwill 413 18,874 18,528 2,310 40,125 — 40,125
Provision for credit and lease residual losses
on fi nance subsidiaries—receivables ¥ — ¥ — ¥ 77,016 ¥ — ¥ 77,016 ¥ — ¥ 77,016
Annual Report 2009 71