Honda 2009 Annual Report Download - page 60
Download and view the complete annual report
Please find page 60 of the 2009 Honda annual report below. You can navigate through the pages in the report by either clicking on the pages listed below, or by using the keyword search tool below to find specific information within the annual report.-
 1
1 -
2
-
3
-
4
-
5
-
6
-
7
-
8
-
9
-
10
-
11
-
12
-
13
-
14
-
15
-
16
-
17
-
18
-
19
-
20
-
21
-
22
-
23
-
24
-
25
-
26
-
27
-
28
-
29
-
30
-
31
-
32
-
33
-
34
-
35
-
36
-
37
-
38
-
39
-
40
-
41
-
42
-
43
-
44
-
45
-
46
-
47
-
48
-
49
-
 50
50 -
 51
51 -
 52
52 -
 53
53 -
 54
54 -
 55
55 -
 56
56 -
 57
57 -
 58
58 -
 59
59 -
 60
60 -
 61
61 -
 62
62 -
 63
63 -
 64
64 -
 65
65 -
 66
66 -
 67
67 -
 68
68 -
 69
69 -
 70
70 -
71
-
72
-
73
-
74
-
75
-
76
-
77
-
78
-
79
-
80
-
81
-
82
-
83
-
84
-
85
-
86
-
87
-
88
-
89
-
90
-
91
-
92
 |
 |

Actual claims incurred in the future may differ from the
original estimates, which may result in material revisions to the
warranty expense accruals.
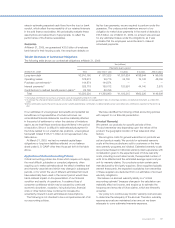
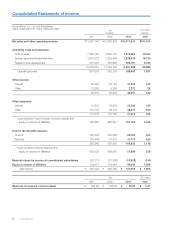
The changes in provisions for those product warranties and
net sales and other operating revenue for each business
segment for each of the years in the three-year period ended
March 31, 2009 are as follows:
(Credit Losses)
Our fi nance subsidiaries provide wholesale fi nancing to dealers
and retail lending and leasing to customers mainly in order to
support sales of our products, principally in North America. We
classify retail and direct fi nancing lease receivables derived
from those services as fi nance subsidiaries-receivables.
Operating leases are classifi ed as property on operating leases.
Certain fi nance receivables related to sales of inventory are
included in trade receivables and other assets in the
consolidated balance sheets.
The majority of the credit risk is with consumer fi nancing
and to a lesser extent with dealer fi nancing. To determine the
overall allowance for credit loss amount, receivables are
segmented into pools with common characteristics such as
product and collateral types, credit grades, and original loan
terms. For each of these pools, we estimate losses primarily
based on our historic loss experiences, delinquency rates,
recovery rates and scale and composition of the portfolio,
taking factors into consideration such as changing economic
conditions and changes in operational policies and procedures.
Estimated losses due to customer defaults on operating leases
are not recognized in the allowance for credit losses. These
losses are recognized as a component of impairment losses on
operating leases.
We believe our allowance for credit losses is a “critical
accounting estimate” because it requires us to make
assumptions about inherently uncertain items such as future
economic trends, quality of fi nance subsidiaries receivables and
other factors. We review the adequacy of the allowance for
credit losses, and the allowance for credit losses is maintained
at an amount that we deem suffi cient to cover the estimated
credit losses incurred on our owned portfolio of fi nance
receivables. However, actual losses may differ from the original
estimates as a result of actual results varying from those
assumed in our estimates.
As an example of the sensitivity of the allowance calculation,
the following scenario demonstrates the impact that a deviation
in one of the primary factors estimated as a part of our
allowance calculation would have on the provision and
allowance for credit losses. If we had experienced a 10%
increase in net credit losses during fi scal 2009 in our North
America portfolio, the provision for fi scal 2009 and the
allowance balance at the end of fi scal 2009 would have
increased by approximately ¥7.6 billion and ¥3.1 billion,
respectively. Note that this sensitivity analysis may be
asymmetric, and are specifi c to the base conditions in fi scal
2009.
Yen (millions)
Fiscal years ended March 31 2007 2008 2009
Provisions for product warranties
Balance at beginning of year ¥ 283,947 ¥ 317,103 ¥ 293,760
Warranty claims paid during the period (113,454) (137,591) (123,509)
Liabilities accrued for warranties issued during the period 143,280 136,355 79,576
Changes in liabilities for pre-existing warranties during the period 605 (1,476) 2,233
Foreign currency translation 2,725 (20,631) (18,081)
Balance at end of year 317,103 293,760 233,979
Net sales and other operating revenue ¥11,087,140 ¥12,002,834 ¥10,011,241
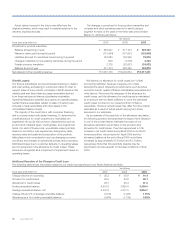
Additional Narrative of the Change in Credit Loss
The following table shows information related to our credit loss experience in our North American portfolio:
Yen (billions)
Fiscal years ended March 31 2007 2008 2009
Charge-offs (net of recoveries) ¥ 26.2 ¥ 39.9 ¥ 44.4
Provision for credit losses 25.5 44.8 49.7
Allowance for credit losses 28.7 28.4 31.4
Ending receivable balance 4,351.8 3,890.4 3,396.4
Average receivable balance, net 4,330.8 4,317.0 3,864.7
Charge-offs as a % of average receivable balance 0.61% 0.93% 1.15%
Allowance as a % of ending receivable balance 0.66% 0.73% 0.93%
Annual Report 2009
58