Honda 2009 Annual Report Download - page 74
Download and view the complete annual report
Please find page 74 of the 2009 Honda annual report below. You can navigate through the pages in the report by either clicking on the pages listed below, or by using the keyword search tool below to find specific information within the annual report.-
 1
1 -
2
-
3
-
4
-
5
-
6
-
7
-
8
-
9
-
10
-
11
-
12
-
13
-
14
-
15
-
16
-
17
-
18
-
19
-
20
-
21
-
22
-
23
-
24
-
25
-
26
-
27
-
28
-
29
-
30
-
31
-
32
-
33
-
34
-
35
-
36
-
37
-
38
-
39
-
40
-
41
-
42
-
43
-
44
-
45
-
46
-
47
-
48
-
49
-
50
-
51
-
52
-
53
-
54
-
55
-
56
-
57
-
58
-
59
-
60
-
61
-
62
-
63
-
 64
64 -
 65
65 -
 66
66 -
 67
67 -
 68
68 -
 69
69 -
 70
70 -
 71
71 -
 72
72 -
 73
73 -
 74
74 -
 75
75 -
 76
76 -
 77
77 -
 78
78 -
 79
79 -
 80
80 -
 81
81 -
 82
82 -
 83
83 -
 84
84 -
85
-
86
-
87
-
88
-
89
-
90
-
91
-
92
 |
 |

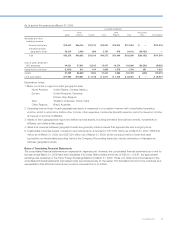
As of and for the year ended March 31, 2009
U.S. dollars (millions)
Motorcycle
Business
Automobile
Business
Financial
Services
Business
Power Product
and Other
Businesses
Segment
Total
Reconciling
Items Consolidated
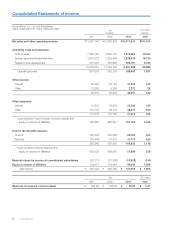
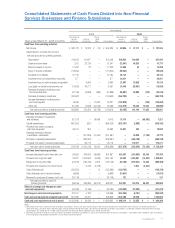
Net sales and other operating revenue:
External customers $14,369 $78,127 $ 5,928 $3,492 $101,916 $ — $101,916
Intersegment — — 145 263 408 (408) —
Total 14,369 78,127 6,073 3,755 102,324 (408) 101,916
Cost of sales, SG&A and R&D expenses 13,352 77,877 5,252 3,912 100,393 (408) 99,985
Segment income (loss) 1,017 250 821 (157) 1,931 — 1,931
Equity in income of affi liates 266 730 — 12 1,008 — 1,008
Assets 10,660 53,135 58,391 2,805 124,991 (4,672) 120,319
Investments in affi liates 1,094 3,859 — 165 5,118 — 5,118
Depreciation and amortization 521 3,800 2,029 141 6,491 — 6,491
Capital expenditures 920 5,330 6,832 173 13,255 — 13,255
Impairment loss on long-lived assets and goodwill 4 192 189 23 408 — 408
Provision for credit and lease residual losses
on fi nance subsidiaries—receivables $— $— $784 $—
$784 $— $784
Explanatory notes:
1. Segment income (loss) is measured in a consistent manner with consolidated operating income, which is net income before other
income, other expenses, income tax (benefi t) expense, minority interest in income, and equity in income of affi liates. Expenses not
directly associated with specifi c segments are allocated based on the most reasonable measures applicable.
2. Assets of each segment are defi ned as total assets, including derivative fi nancial instruments, investments in affi liates, and
deferred tax assets. Segment assets are based on those directly associated with each segment and those not directly
associated with specifi c segments are allocated based on the most reasonable measures applicable except for the corporate
assets described below.
3. Intersegment sales and revenues are generally made at values that approximate arm’s-length prices.
4. Unallocated corporate assets, included in reconciling items, amounted to ¥377,873 million as of March 31, 2007, ¥385,442
million as of March 31, 2008, and ¥257,291 million ($2,619 million) as of March 31, 2009, which consist primarily of cash and
cash equivalents and marketable securities held by the Company. Reconciling items also include elimination of intersegment
transactions.
5. Depreciation and amortization of the Financial Services Business include ¥9,741 million for the year ended March 31, 2007,
¥101,032 million for the year ended March 31, 2008 and ¥195,776 million ($1,993 million) for the year ended March 31, 2009
related to depreciation of property on operating leases.
6. Capital expenditures of the Financial Services Business includes ¥366,795 million for the year ended March 31, 2007, ¥839,261
million for the year ended March 31, 2008 and ¥668,128 million ($6,802 million) for the year ended March 31, 2009 related to
purchases of operating lease assets.
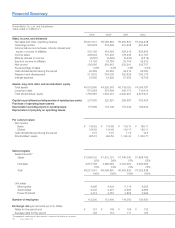
External Sales and Other Operating Revenue by Product or Service Groups
Yen
(millions)
U.S. dollars
(millions)
Years ended March 31: 2007 2008 2009 2009
Motorcycles and relevant parts ¥ 1,221,638 ¥ 1,418,028 ¥ 1,323,259 $ 13,471
All-terrain vehicles (ATVs), personal watercraft and relevant parts 148,979 140,668 88,252 898
Automobiles and relevant parts 8,889,080 9,489,391 7,674,404 78,127
Financial, insurance services 409,701 533,553 582,261 5,928
Power products and relevant parts 287,302 288,243 224,648 2,287
Others 130,440 132,951 118,417 1,205
Total ¥11,087,140 ¥12,002,834 ¥10,011,241 $101,916
Annual Report 2009
72