Honda 2009 Annual Report Download - page 64
Download and view the complete annual report
Please find page 64 of the 2009 Honda annual report below. You can navigate through the pages in the report by either clicking on the pages listed below, or by using the keyword search tool below to find specific information within the annual report.-
 1
1 -
2
-
3
-
4
-
5
-
6
-
7
-
8
-
9
-
10
-
11
-
12
-
13
-
14
-
15
-
16
-
17
-
18
-
19
-
20
-
21
-
22
-
23
-
24
-
25
-
26
-
27
-
28
-
29
-
30
-
31
-
32
-
33
-
34
-
35
-
36
-
37
-
38
-
39
-
40
-
41
-
42
-
43
-
44
-
45
-
46
-
47
-
48
-
49
-
50
-
51
-
52
-
53
-
 54
54 -
 55
55 -
 56
56 -
 57
57 -
 58
58 -
 59
59 -
 60
60 -
 61
61 -
 62
62 -
 63
63 -
 64
64 -
 65
65 -
 66
66 -
 67
67 -
 68
68 -
 69
69 -
 70
70 -
 71
71 -
 72
72 -
 73
73 -
 74
74 -
75
-
76
-
77
-
78
-
79
-
80
-
81
-
82
-
83
-
84
-
85
-
86
-
87
-
88
-
89
-
90
-
91
-
92
 |
 |

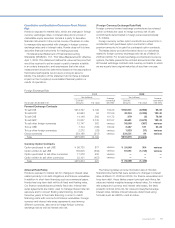
Finance Subsidiaries—Receivables
2008 2009
Yen (millions) Yen (millions)
Expected maturity date
Average
interest
rateTotal Fair value Total Within 1 year 1-2 year 2-3 year 3-4 year 4-5 year Thereafter Fair value
Direct fi nancing leases
*1
JP¥ ¥ 23,580 — ¥ 24,720 14,156 5,364 3,035 1,438 725 2 — 4.83%
US$ 657,278 — 199,172 179,717 19,115 339 1 — — — 6.00%
Other 531,776 —475,409 136,583 144,600 110,581 71,899 11,729 17 —3.92%
Total—Direct Financing Leases ¥1,212,634 —¥ 699,301 330,456 169,079 113,955 73,338 12,454 19 —
Other Finance Receivables:
JP¥ ¥ 441,695 437,032 ¥ 450,177 150,408 114,770 83,856 51,594 31,828 17,721 445,588 4.83%
US$ 2,515,518 2,645,690 2,561,667 904,796 577,081 494,761 375,378 175,880 33,771 2,481,293 5.55%
Other 610,201 524,144 504,599 234,525 121,639 82,669 45,841 17,083 2,842 499,198 6.10%
Total—Other Finance Receivables ¥3,567,414 3,606,866 ¥3,516,443 1,289,729 813,490 661,286 472,813 224,791 54,334 3,426,079
Retained interest in securitizations
*2
54,636 54,636 45,648 45,648
Total
*3
¥4,834,684 ¥4,261,392
*1 : Under U.S. generally accepted accounting principles, disclosure of fair values of direct fi nancing leases is not required.
*2 : The retained interest in securitizations is accounted for as “trading” securities and is reported at fair value.
*3 : The fi nance subsidiaries—receivables include fi nance subsidiaries—receivables included in trade receivables and other assets in the consolidated balance sheets.
Long-Term Debt (including current portion)
2008 2009
Yen (millions) Yen (millions)
Expected maturity date
Average
interest Total Fair value Total Within 1 year 1-2 year 2-3 year 3-4 year 4-5 year Thereafter Fair value
Japanese yen bonds
¥ 250,080 251,166 ¥ 260,000 60,000 60,000 70,000 30,000 40,000 — 290,411 1.18%
Japanese yen medium-term notes (Fixed rate)
321,600 324,504 220,263 74,645 77,425 33,650 25,113 6,452 2,978 213,717 1.18%
Japanese yen medium-term notes (Floating rate)
165,000 166,308 125,865 20,647 28,687 16,378 58,168 1,985 — 118,553 1.01%
U.S. dollar medium-term notes (Fixed rate)
274,346 286,869 390,098 73,511 50,968 34,305 — 143,101 88,213 359,107 5.57%
U.S. dollar medium-term notes (Floating rate)
1,005,456 1,010,974 796,545 632,125 65,915 98,505———780,050 1.45%
Loans and others—primarily fi xed rate
691,220 701,228 1,117,389 116,595 320,430 181,361 219,545 274,580 4,878 1,023,938 3.92%
Total
¥2,707,702
2,741,049 ¥2,910,160 977,523 603,425 434,199 332,826 466,118 96,069 2,785,776
Interest Rate Swaps
2008 2009
Yen (millions) Yen (millions)
Notional
principal
currency
Expected maturity date
Average
receive
rate
Average
pay
rateReceive/Pay Contract
amounts Fair value Contract
amount Within 1 year 1-2 year 2-3 year 3-4 year 4-5 year Thereafter Fair value
JP¥ Float/Fix ¥ 2,330 (4) ¥ 510 110 400 — — — — (3) 1.02% 1.55%
US$ Float/Fix 2,885,355 (81,730) 2,866,860 1,226,632 938,069 562,758 119,804 19,597 — (88,322) 1.34% 3.95%
Fix/Float 403,333
1
3,135 599,600 146,528 112,343 58,373 1,418 192,531 88,407 36,867 5.35% 2.81%
Float/Float 67,127 (36) 24,558 24,558 — — — — — (76) 1.12% 1.56%
CA$ Float/Fix 658,179 (9,924) 570,945 206,140 166,961 104,088 70,434 22,847 475 (25,298) 0.85% 3.69%
Fix/Float 154,287 4,418 210,427 7,714 39,022 46,769 46,769 70,153 — 17,372 5.22% 2.03%
Float/Float 100,876 (325) 32,222 21,901 10,321 — — — — (143) 0.64% 1.00%
GBP Float/Fix 23,469 83 22,002 11,377 10,625 — — — — (691) 2.33% 5.00%
Total ¥4,294,956 (74,383) ¥4,327,124 1,644,960 1,277,741 771,988 238,425 305,128 88,882 (60,294)
Annual Report 2009
62