Honda 2009 Annual Report Download - page 71
Download and view the complete annual report
Please find page 71 of the 2009 Honda annual report below. You can navigate through the pages in the report by either clicking on the pages listed below, or by using the keyword search tool below to find specific information within the annual report.-
 1
1 -
2
-
3
-
4
-
5
-
6
-
7
-
8
-
9
-
10
-
11
-
12
-
13
-
14
-
15
-
16
-
17
-
18
-
19
-
20
-
21
-
22
-
23
-
24
-
25
-
26
-
27
-
28
-
29
-
30
-
31
-
32
-
33
-
34
-
35
-
36
-
37
-
38
-
39
-
40
-
41
-
42
-
43
-
44
-
45
-
46
-
47
-
48
-
49
-
50
-
51
-
52
-
53
-
54
-
55
-
56
-
57
-
58
-
59
-
60
-
 61
61 -
 62
62 -
 63
63 -
 64
64 -
 65
65 -
 66
66 -
 67
67 -
 68
68 -
 69
69 -
 70
70 -
 71
71 -
 72
72 -
 73
73 -
 74
74 -
 75
75 -
 76
76 -
 77
77 -
 78
78 -
 79
79 -
 80
80 -
 81
81 -
82
-
83
-
84
-
85
-
86
-
87
-
88
-
89
-
90
-
91
-
92
 |
 |

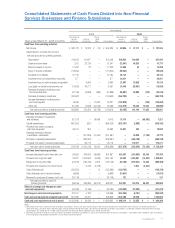
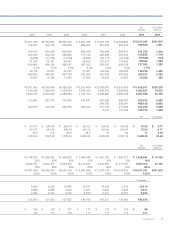
Consolidated Statements of Cash Flows
Honda Motor Co., Ltd. and Subsidiaries
Years ended March 31, 2007, 2008 and 2009 Yen
(millions)
U.S. dollars
(millions)
2007 2008 2009 2009
Cash fl ows from operating activities:
Net income
¥ 592,322 ¥ 600,039 ¥ 137,005 $ 1,395
Adjustments to reconcile net income to net cash provided by operating activities:
Depreciation excluding property on operating leases
361,747 417,393 441,868 4,498
Depreciation of property on operating leases
9,741 101,032 195,776 1,993
Deferred income taxes
(16,448) 31,341 41,773 425
Minority interest in income
20,117 27,308 13,928 141
Equity in income of affi liates
(103,417) (118,942) (99,034) (1,008)
Dividends from affi liates
54,849 67,764 65,140 663
Provision for credit and lease residual losses on fi nance subsidiaries—receivables
44,128 58,011 77,016 784
Impairment loss on investments in securities
798 577 26,001 265
Impairment loss on long-lived assets and goodwill excluding property on operating leases
——21,597 220
Impairment loss on property on operating leases
559 5,850 18,528 189
Loss (gain) on derivative instruments, net
56,836 70,251 (15,506) (158)
Decrease (increase) in assets:
Trade accounts and notes receivable
(49,529) (67,696) (30,025) (306)
Inventories
(96,839) (100,622) (262,782) (2,675)
Other current assets
(15,206) (2,609) (82,838) (843)
Other assets
(5,523) (130,666) 8,640 88
Increase (decrease) in liabilities:
Trade accounts and notes payable
38,186 32,327 (133,662) (1,361)
Accrued expenses
41,898 (24,768) (102,711) (1,046)
Income taxes payable
(37,282) 20 (12,861) (131)
Other current liabilities
1,103 2,301 10,630 108
Other liabilities
14,274 179,537 74,872 762
Other, net
(7,789) (21,530)
(9,714) (97)
Net cash provided by operating activities
904,525 1,126,918
383,641 3,906
Cash fl ows from investing activities:
Increase in investments and advances
(9,874) (6,417) (4,879) (50)
Decrease in investments and advances
3,829 1,270 1,921 20
Payments for purchases of available-for-sale securities
(141,902) (158,426) (31,936) (325)
Proceeds from sales of available-for-sale securities
172,806 179,911 26,896 274
Payments for purchases of held-to-maturity securities
(13,614) (39,482) (17,348) (177)
Proceeds from redemptions of held-to-maturity securities
41,109 32,557 32,667 333
Capital expenditures
(597,958) (668,228) (635,190) (6,466)
Proceeds from sales of property, plant and equipment
20,641 26,868 18,843 192
Acquisitions of fi nance subsidiaries—receivables
(2,857,024) (2,712,775) (2,303,930) (23,455)
Collections of fi nance subsidiaries—receivables
2,138,875 2,312,311 2,023,031 20,595
Proceeds from sales of fi nance subsidiaries—receivables
477,927 158,497 324,672 3,305
Purchases of operating lease assets
(366,795) (839,261) (668,128) (6,802)
Proceeds from sales of operating lease assets
1,276 26,776
100,017 1,018
Net cash used in investing activities
(1,130,704) (1,686,399)
(1,133,364) (11,538)
Cash fl ows from fi nancing activities:
Increase (decrease) in short-term debt, net
306,063 601,957 270,795 2,757
Proceeds from long-term debt
969,491 1,061,792 1,299,984 13,233
Repayments of long-term debt
(677,539) (782,749) (889,483) (9,055)
Cash dividends paid
(140,482) (152,590) (139,724) (1,422)
Cash dividends paid to minority interests
(7,434) (9,663) (10,841) (110)
Sales (purchases) of treasury stock, net
(26,689) (30,746)
131 1
Net cash provided by fi nancing activities
423,410 688,001
530,862 5,404
Effect of exchange rate changes on cash and cash equivalents
31,527 (23,164)
(141,672) (1,442)
Net change in cash and cash equivalents
228,758 105,356
(360,533) (3,670)
Cash and cash equivalents at beginning of year
716,788 945,546
1,050,902 10,698
Cash and cash equivalents at end of year
¥ 945,546 ¥1,050,902
¥ 690,369 $ 7,028
Annual Report 2009 69