Honda 2009 Annual Report Download - page 76
Download and view the complete annual report
Please find page 76 of the 2009 Honda annual report below. You can navigate through the pages in the report by either clicking on the pages listed below, or by using the keyword search tool below to find specific information within the annual report.-
 1
1 -
2
-
3
-
4
-
5
-
6
-
7
-
8
-
9
-
10
-
11
-
12
-
13
-
14
-
15
-
16
-
17
-
18
-
19
-
20
-
21
-
22
-
23
-
24
-
25
-
26
-
27
-
28
-
29
-
30
-
31
-
32
-
33
-
34
-
35
-
36
-
37
-
38
-
39
-
40
-
41
-
42
-
43
-
44
-
45
-
46
-
47
-
48
-
49
-
50
-
51
-
52
-
53
-
54
-
55
-
56
-
57
-
58
-
59
-
60
-
61
-
62
-
63
-
64
-
65
-
 66
66 -
 67
67 -
 68
68 -
 69
69 -
 70
70 -
 71
71 -
 72
72 -
 73
73 -
 74
74 -
 75
75 -
 76
76 -
 77
77 -
 78
78 -
 79
79 -
 80
80 -
 81
81 -
 82
82 -
 83
83 -
 84
84 -
 85
85 -
 86
86 -
87
-
88
-
89
-
90
-
91
-
92
 |
 |

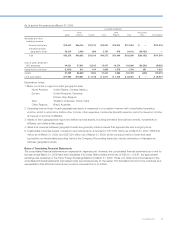
(2) Supplemental geographical information based on the location of the Company and its subsidiaries
As of and for the year ended March 31, 2007
Yen (millions)
Japan
North
America Europe Asia
Other
Regions Total
Reconciling
Items Consolidated
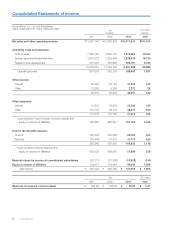
Net sales and other
operating revenue:
External customers ¥2,061,720 ¥6,002,797 ¥1,228,564 ¥1,024,680 ¥769,379 ¥11,087,140 ¥ — ¥11,087,140
Transfers between
geographic areas 2,712,403 169,847 119,161 246,723 28,259 3,276,393 (3,276,393) —
Total 4,774,123 6,172,644 1,347,725 1,271,403 797,638 14,363,533 (3,276,393) 11,087,140
Cost of sales, SG&A and
R&D expenses 4,545,988 5,715,817 1,315,736 1,194,250 725,377 13,497,168 (3,261,907) 10,235,261
Operating income 228,135 456,827 31,989 77,153 72,261 866,365 (14,486) 851,879
Assets 2,985,123 6,834,409 948,922 935,963 414,147 12,118,564 (82,064) 12,036,500
Long-lived assets ¥ 992,723 ¥1,028,132 ¥ 198,232 ¥ 219,358 ¥ 93,485 ¥ 2,531,930 ¥ — ¥ 2,531,930
As of and for the year ended March 31, 2008
Yen (millions)
Japan
North
America Europe Asia
Other
Regions Total
Reconciling
Items Consolidated
Net sales and other
operating revenue:
External customers ¥2,053,401 ¥6,091,512 ¥1,502,240 ¥1,307,117 ¥1,048,564 ¥12,002,834 ¥ — ¥12,002,834
Transfers between
geographic areas 2,835,639 173,751 91,983 331,173 44,253 3,476,799 (3,476,799) —
Total 4,889,040 6,265,263 1,594,223 1,638,290 1,092,817 15,479,633 (3,476,799) 12,002,834
Cost of sales, SG&A and
R&D expenses 4,696,482 5,832,635 1,542,676 1,507,566 976,335 14,555,694 (3,505,969) 11,049,725
Operating income 192,558 432,628 51,547 130,724 116,482 923,939 29,170 953,109
Assets 3,127,143 6,863,970 948,544 1,080,439 574,890 12,594,986 20,557 12,615,543
Long-lived assets ¥1,084,163 ¥1,589,356 ¥ 171,030 ¥ 260,141 ¥ 128,156 ¥ 3,232,846 ¥ — ¥ 3,232,846
As of and for the year ended March 31, 2009
Yen (millions)
Japan
North
America Europe Asia
Other
Regions Total
Reconciling
Items Consolidated
Net sales and other
operating revenue:
External customers ¥1,871,962 ¥4,534,684 ¥1,191,540 ¥1,335,091 ¥1,077,964 ¥10,011,241 ¥ — ¥10,011,241
Transfers between
geographic areas 2,290,625 244,440 87,362 273,140 66,256 2,961,823 (2,961,823) —
Total 4,162,587 4,779,124 1,278,902 1,608,231 1,144,220 12,973,064 (2,961,823) 10,011,241
Cost of sales, SG&A and
R&D expenses 4,324,203 4,699,422 1,268,701 1,504,628 1,009,158 12,806,112 (2,984,514) 9,821,598
Operating income (loss) (161,616) 79,702 10,201 103,603 135,062 166,952 22,691 189,643
Assets 3,078,478 6,547,880 766,594 1,016,059 450,081 11,859,092 (40,175) 11,818,917
Long-lived assets ¥1,140,316 ¥1,918,579 ¥ 110,543 ¥ 253,113 ¥ 119,373 ¥ 3,541,924 ¥ — ¥ 3,541,924
Annual Report 2009
74